
Most African American cities in Utah research summary. We used Saturday Night Science to analyze Utah’s most recent Census data to determine the blackest cities in Utah based on the percentage of Black residents. Here are the results of our analysis:
-
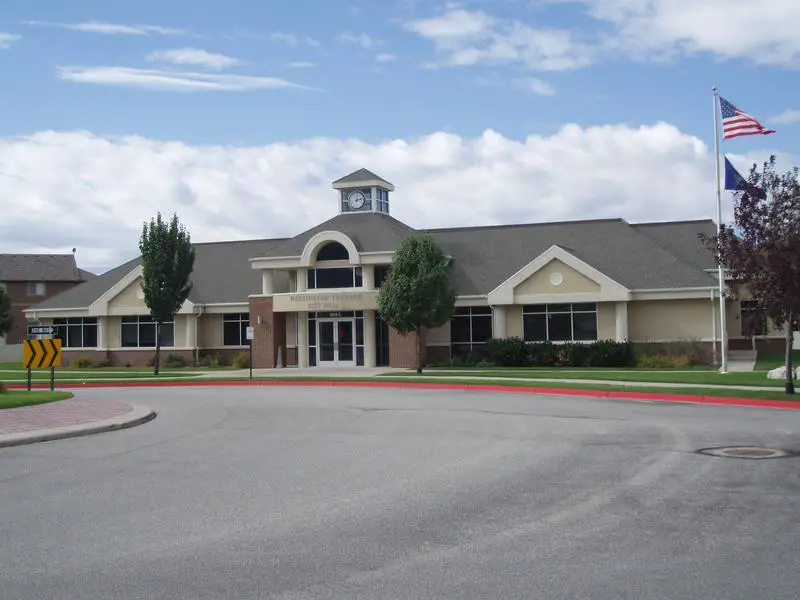
The city with the largest African American population in Utah is Washington Terrace based on the most recent Census data.
-
Washington Terrace is 3.57% Black.
-
The least African American city in Utah is Plain City.
-
Plain City is 0.0% Black.
-
Utah is 1.1% Black.
-
Utah is the 47th blackest state in the United States.
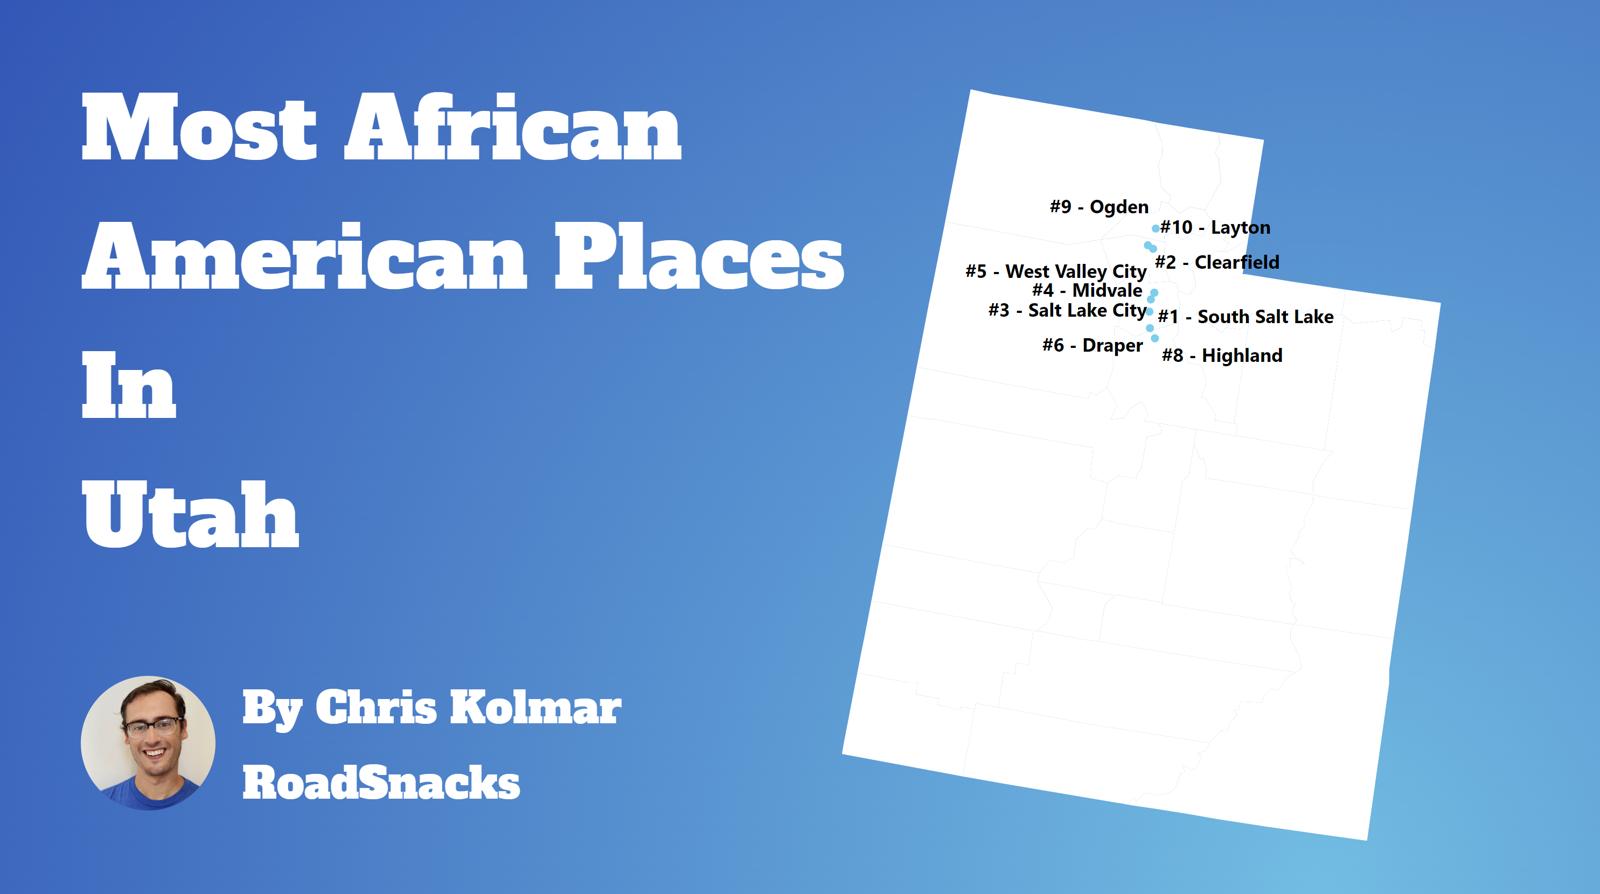
Table Of Contents: Top Ten | Methodology | Summary | Table
The Black community is one of the fastest-growing communities in America this decade.
Roughly 42 million people identifying as Black or African American live in the United States, making up 12% of the total population. According to the most recent American Community Survey, the Black population in Utah is 36,249 – at 1.1% of the total population of Utah.
The percentage growth of Blacks in America is the third largest percentage change for any race according to the Census’s race and ethnicity definition. Most scholars and historians agree that increasing diversity in America is a good thing.
We agree.
But how has the increase in the black population impacted Utah? Which cities and towns in Utah have seen the greatest increase in its Black population?
We broke down the most recent census data to determine the cities in Utah with the largest African American population in 2026:
Most African American Places In Utah
What’s the blackest city in Utah? The city with the largest Black population in Utah for 2026 is Washington Terrace. See if Washington Terrace ranked as one of the most african american places in America.
And if you already knew these places were Black, check out the best places to live in Utah or the most diverse places in Utah.
The 10 Blackest Cities In Utah For 2026
1. Washington Terrace
/10
Population: 9,182
% African American: 3.57%
# Of African American Residents: 328
Percent Change Since 2010: -8.38%
More on Washington Terrace: Data | Cost Of Living | Movers
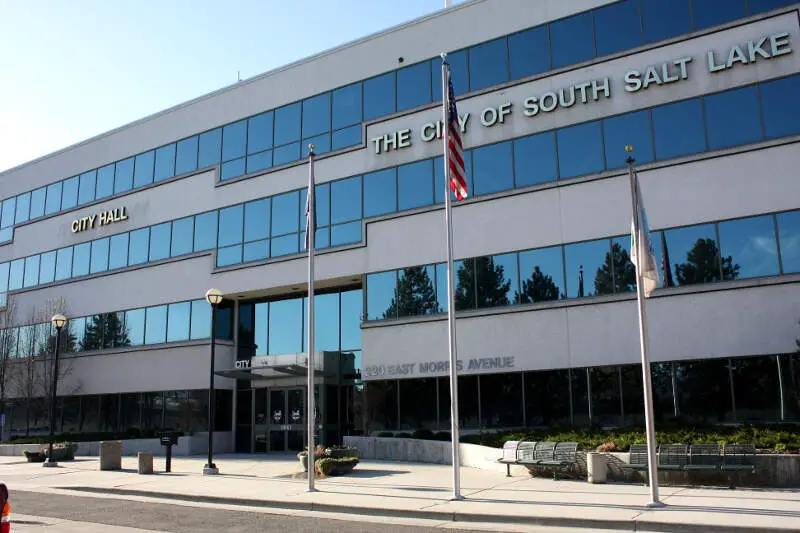
2. South Salt Lake
/10
Population: 26,352
% African American: 3.18%
# Of African American Residents: 838
Percent Change Since 2010: 74.22%
More on South Salt Lake: Data | Cost Of Living | Movers
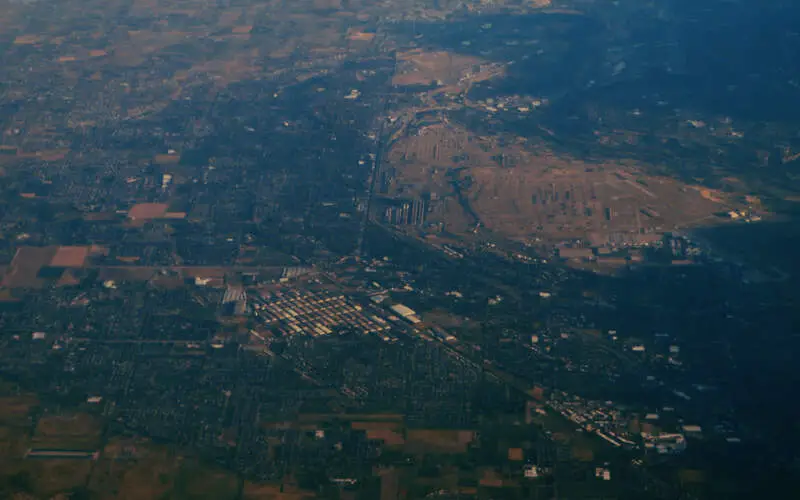
3. Sunset
/10
Population: 5,587
% African American: 2.92%
# Of African American Residents: 163
Percent Change Since 2010: 75.27%
More on Sunset: Data | Cost Of Living | Movers
4. Clearfield
/10
Population: 33,523
% African American: 2.51%
# Of African American Residents: 840
Percent Change Since 2010: -0.83%
More on Clearfield: Data | Cost Of Living | Movers
5. West Valley City
/10
Population: 138,437
% African American: 2.33%
# Of African American Residents: 3,225
Percent Change Since 2010: 146.75%
More on West Valley City: Data | Cost Of Living | Movers
6. Taylorsville
/10
Population: 58,678
% African American: 2.3%
# Of African American Residents: 1,351
Percent Change Since 2010: 6.29%
More on Taylorsville: Data | Cost Of Living | Movers
7. Ephraim
/10
Population: 5,949
% African American: 2.27%
# Of African American Residents: 135
Percent Change Since 2010: -15.62%
More on Ephraim: Data | Cost Of Living | Movers
8. Salt Lake City
/10
Population: 208,007
% African American: 2.27%
# Of African American Residents: 4,713
Percent Change Since 2010: -14.22%
More on Salt Lake City: Data | Cost Of Living | Movers
9. Murray
/10
Population: 50,188
% African American: 1.81%
# Of African American Residents: 910
Percent Change Since 2010: 78.43%
More on Murray: Data | Cost Of Living | Movers
10. Ogden
/10
Population: 87,413
% African American: 1.77%
# Of African American Residents: 1,550
Percent Change Since 2010: -3.25%
More on Ogden: Data | Cost Of Living | Movers
Methodology: How We Determined The Cities In Utah With The Largest Black Population For 2026
We still believe in the accuracy of data — especially from the Census. So that’s where we went to get the race breakdown across Utah.
That leads us to the Census’s most recently available data, the 2020-2024 American Community Survey data from the US Census.
Specifically, we looked at table B03002: Hispanic OR LATINO ORIGIN BY RACE. Here are the category names as defined by the Census:
- Hispanic or Latino
- White alone*
- Black or African American alone*
- American Indian and Alaska Native alone*
- Asian alone*
- Native Hawaiian and Other Pacific Islander alone*
- Some other race alone*
- Two or more races*
Our particular column of interest was the number of people who identified as Black or African American.
We limited our analysis to non-CDPs with a population greater than 5,000 people in Utah. That left us with 82 cities.
We then calculated the percentage of residents that are Black or African American. The percentages ranked from 3.6% to 0.0%.
Finally, we ranked each city based on the percentage of the Black population, with a higher score being more Black than a lower score. Washington Terrace took the distinction of being the most Black, while Plain City was the least African American city.
We updated this article for 2026. This is our eleventh time ranking the cities in Utah with the largest African American population.
Read on for more information on how the cities in Utah ranked by population of African American residents or, for a more general take on diversity in America, head over to our ranking of the most diverse cities in America.
Summary: Black Populations Across Utah
If you’re looking for a breakdown of African American populations across Utah according to the most recent data, this is an accurate list.
The blackest cities in Utah are Washington Terrace, South Salt Lake, Sunset, Clearfield, West Valley City, Taylorsville, Ephraim, Salt Lake City, Murray, and Ogden.
If you’re curious enough, here are the least African American places in Utah:
- Plain City
- Hyrum
- Enoch
For more Utah reading, check out:
African American Population By City In Utah
| Rank | City | Population | African American Population | % African American |
|---|---|---|---|---|
| 1 | Washington Terrace | 9,182 | 328 | 3.57% |
| 2 | South Salt Lake | 26,352 | 838 | 3.18% |
| 3 | Sunset | 5,587 | 163 | 2.92% |
| 4 | Clearfield | 33,523 | 840 | 2.51% |
| 5 | West Valley City | 138,437 | 3,225 | 2.33% |
| 6 | Taylorsville | 58,678 | 1,351 | 2.3% |
| 7 | Ephraim | 5,949 | 135 | 2.27% |
| 8 | Salt Lake City | 208,007 | 4,713 | 2.27% |
| 9 | Murray | 50,188 | 910 | 1.81% |
| 10 | Ogden | 87,413 | 1,550 | 1.77% |
| 11 | Draper | 50,278 | 891 | 1.77% |
| 12 | Centerville | 16,679 | 282 | 1.69% |
| 13 | Midvale | 35,989 | 593 | 1.65% |
| 14 | Logan | 54,907 | 868 | 1.58% |
| 15 | Santaquin | 16,436 | 247 | 1.5% |
| 16 | Highland | 20,119 | 294 | 1.46% |
| 17 | South Ogden | 17,650 | 238 | 1.35% |
| 18 | Nephi | 6,885 | 88 | 1.28% |
| 19 | West Jordan | 116,692 | 1,445 | 1.24% |
| 20 | Syracuse | 35,488 | 434 | 1.22% |
| 21 | Layton | 83,286 | 989 | 1.19% |
| 22 | Bountiful | 45,023 | 533 | 1.18% |
| 23 | Mapleton | 13,114 | 150 | 1.14% |
| 24 | Woods Cross | 11,531 | 131 | 1.14% |
| 25 | Tooele | 38,405 | 433 | 1.13% |
| 26 | Payson | 23,039 | 259 | 1.12% |
| 27 | Price | 8,248 | 92 | 1.12% |
| 28 | South Jordan | 82,686 | 922 | 1.12% |
| 29 | West Haven | 21,563 | 233 | 1.08% |
| 30 | Provo | 114,766 | 1,236 | 1.08% |
| 31 | Cedar City | 38,524 | 411 | 1.07% |
| 32 | Herriman | 59,346 | 495 | 0.83% |
| 33 | Kaysville | 33,053 | 266 | 0.8% |
| 34 | Park City | 8,362 | 64 | 0.77% |
| 35 | Holladay | 31,099 | 230 | 0.74% |
| 36 | Orem | 97,182 | 686 | 0.71% |
| 37 | Cottonwood Heights | 32,828 | 229 | 0.7% |
| 38 | Brigham City | 19,992 | 138 | 0.69% |
| 39 | Spanish Fork | 44,946 | 295 | 0.66% |
| 40 | Lindon | 11,765 | 77 | 0.65% |
| 41 | Roy | 38,993 | 244 | 0.63% |
| 42 | Bluffdale | 18,797 | 117 | 0.62% |
| 43 | Lehi | 85,173 | 519 | 0.61% |
| 44 | Pleasant View | 11,217 | 68 | 0.61% |
| 45 | North Ogden | 21,947 | 128 | 0.58% |
| 46 | Harrisville | 6,935 | 39 | 0.56% |
| 47 | Farmington | 25,389 | 137 | 0.54% |
| 48 | Eagle Mountain | 53,290 | 278 | 0.52% |
| 49 | Sandy | 94,291 | 467 | 0.5% |
| 50 | St. George | 101,995 | 488 | 0.48% |
| 51 | Springville | 35,849 | 170 | 0.47% |
| 52 | Alpine | 10,392 | 47 | 0.45% |
| 53 | Pleasant Grove | 37,852 | 170 | 0.45% |
| 54 | Hurricane | 22,771 | 102 | 0.45% |
| 55 | North Salt Lake | 23,474 | 102 | 0.43% |
| 56 | Washington | 32,348 | 139 | 0.43% |
| 57 | Smithfield | 14,408 | 60 | 0.42% |
| 58 | Hooper | 9,338 | 32 | 0.34% |
| 59 | Riverton | 45,457 | 155 | 0.34% |
| 60 | American Fork | 37,109 | 121 | 0.33% |
| 61 | Heber | 18,015 | 53 | 0.29% |
| 62 | West Point | 11,929 | 33 | 0.28% |
| 63 | Salem | 10,324 | 27 | 0.26% |
| 64 | Clinton | 23,612 | 50 | 0.21% |
| 65 | Saratoga Springs | 48,425 | 95 | 0.2% |
| 66 | Grantsville | 14,341 | 28 | 0.2% |
| 67 | Cedar Hills | 9,950 | 19 | 0.19% |
| 68 | Santa Clara | 8,152 | 15 | 0.18% |
| 69 | Vernal | 10,392 | 19 | 0.18% |
| 70 | Richfield | 8,224 | 14 | 0.17% |
| 71 | Riverdale | 9,279 | 15 | 0.16% |
| 72 | South Weber | 8,115 | 11 | 0.14% |
| 73 | North Logan | 11,460 | 11 | 0.1% |
| 74 | Ivins | 9,998 | 9 | 0.09% |
| 75 | Farr West | 7,952 | 7 | 0.09% |
| 76 | Roosevelt | 7,078 | 6 | 0.08% |
| 77 | West Bountiful | 5,915 | 4 | 0.07% |
| 78 | Providence | 8,947 | 4 | 0.04% |
| 79 | Tremonton | 11,477 | 3 | 0.03% |
| 80 | Enoch | 8,144 | 1 | 0.01% |
| 81 | Hyrum | 10,401 | 0 | 0.0% |
| 82 | Plain City | 8,396 | 0 | 0.0% |