
Most African American cities in Washington research summary. We used Saturday Night Science to analyze Washington’s most recent Census data to determine the blackest cities in Washington based on the percentage of Black residents. Here are the results of our analysis:
-
The city with the largest African American population in Washington is SeaTac based on the most recent Census data.
-
SeaTac is 23.88% Black.
-
The least African American city in Washington is Union Gap.
-
Union Gap is 0.0% Black.
-
Washington is 3.8% Black.
-
Washington is the 34th blackest state in the United States.
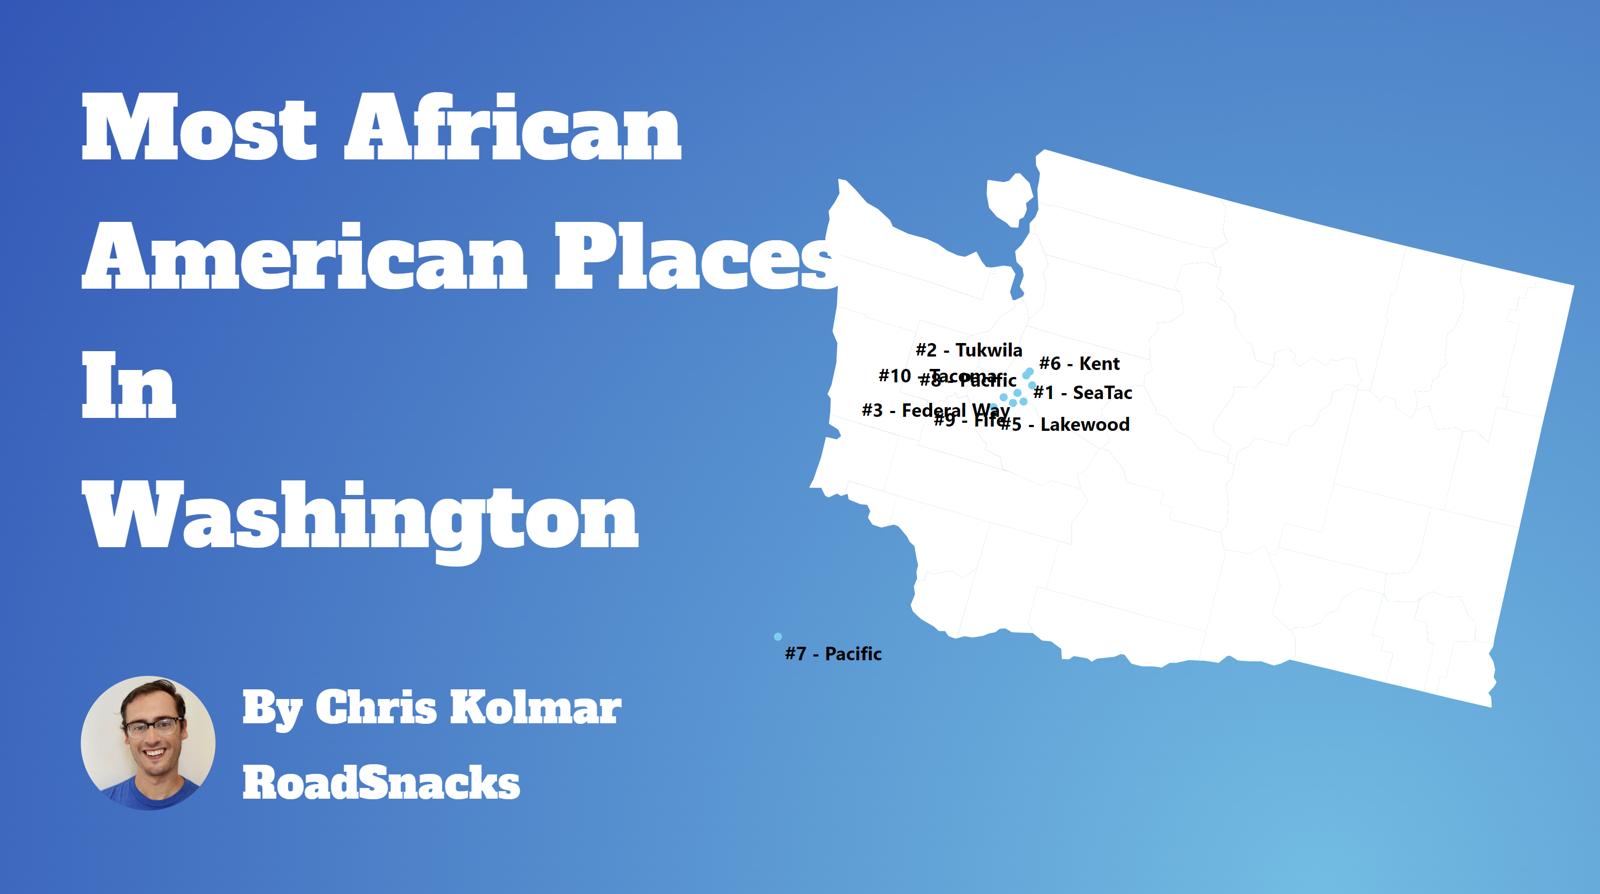
Table Of Contents: Top Ten | Methodology | Summary | Table
The Black community is one of the fastest-growing communities in America this decade.
Roughly 42 million people identifying as Black or African American live in the United States, making up 12% of the total population. According to the most recent American Community Survey, the Black population in Washington is 295,487 – at 3.8% of the total population of Washington.
The percentage growth of Blacks in America is the third largest percentage change for any race according to the Census’s race and ethnicity definition. Most scholars and historians agree that increasing diversity in America is a good thing.
We agree.
But how has the increase in the black population impacted Washington? Which cities and towns in Washington have seen the greatest increase in its Black population?
We broke down the most recent census data to determine the cities in Washington with the largest African American population in 2025:
Most African American Places In Washington
What’s the blackest city in Washington? The city with the largest Black population in Washington for 2025 is SeaTac. See if SeaTac ranked as one of the most african american places in America.
And if you already knew these places were Black, check out the best places to live in Washington or the most diverse places in Washington.
The 10 Blackest Cities In Washington For 2025
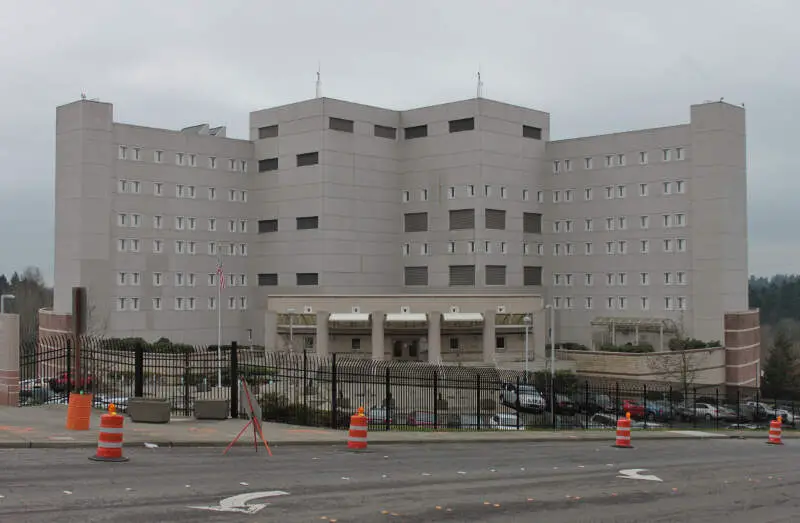
1. Seatac
/10
Population: 31,143
% African American: 23.88%
# Of African American Residents: 7,437
Percent Change Since 2010: 80.42%
More on Seatac: Data
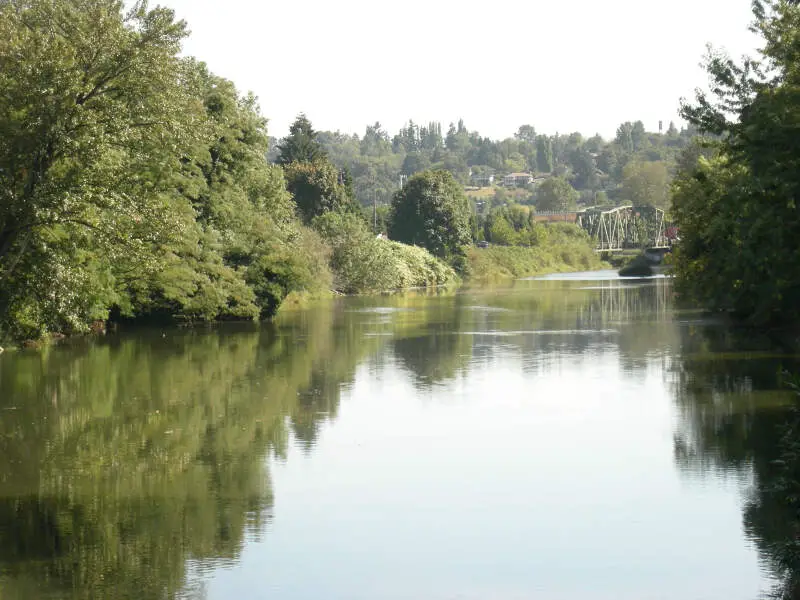
2. Tukwila
/10
Population: 21,479
% African American: 17.43%
# Of African American Residents: 3,743
Percent Change Since 2010: 36.46%
More on Tukwila: Data
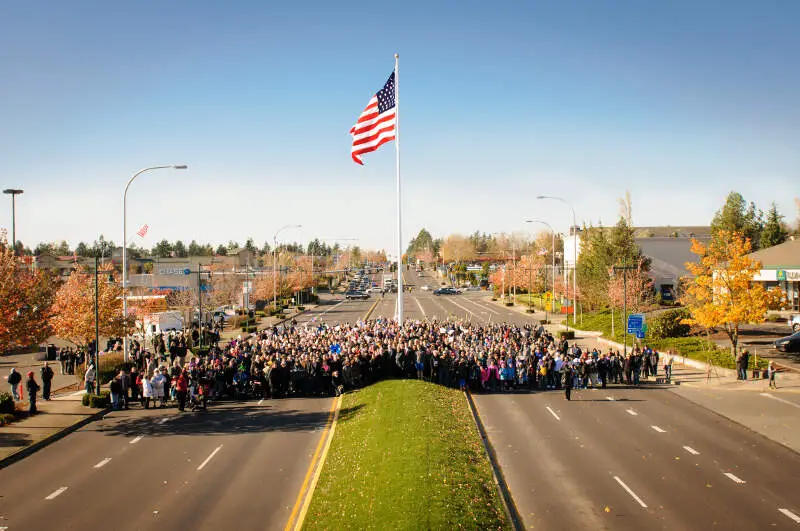
3. Federal Way
/10
Population: 99,232
% African American: 17.35%
# Of African American Residents: 17,218
Percent Change Since 2010: 128.51%
More on Federal Way: Data
4. Kent
/10
Population: 135,015
% African American: 12.99%
# Of African American Residents: 17,541
Percent Change Since 2010: 88.43%
More on Kent: Data
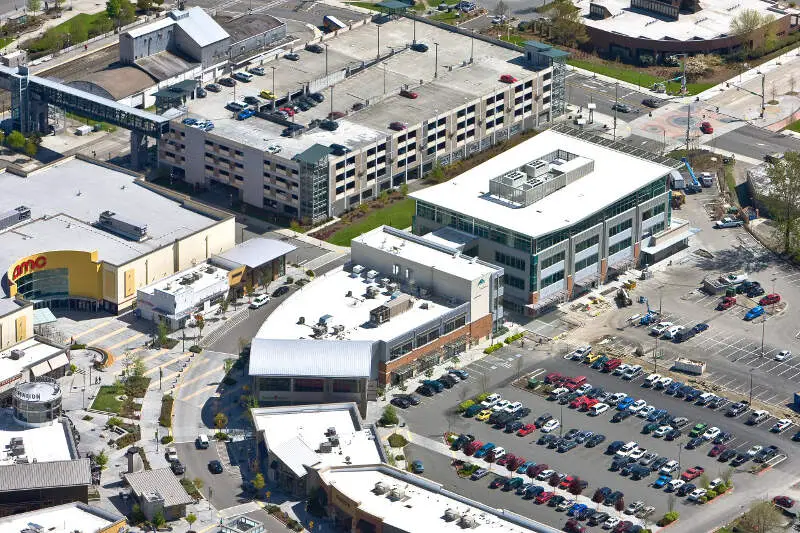
5. Lakewood
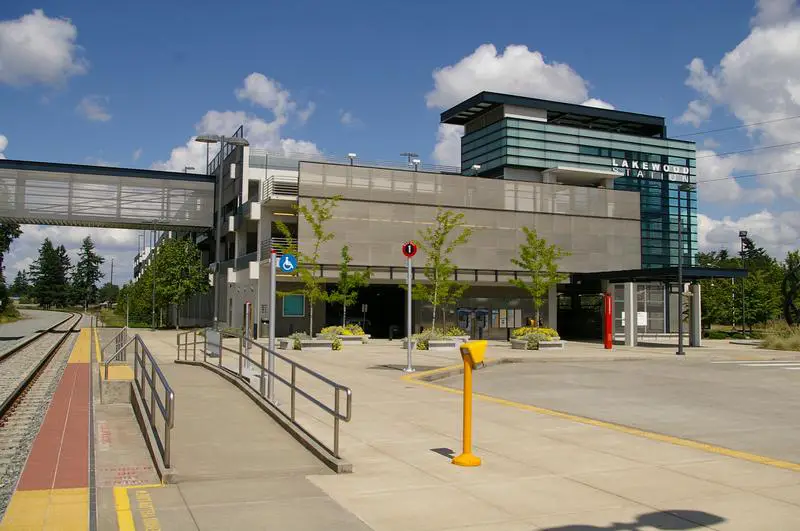
/10
Population: 63,034
% African American: 12.73%
# Of African American Residents: 8,023
Percent Change Since 2010: 8.43%
More on Lakewood: Data
6. Des Moines
/10
Population: 32,545
% African American: 10.84%
# Of African American Residents: 3,529
Percent Change Since 2010: 8.15%
More on Des Moines: Data
7. Tacoma
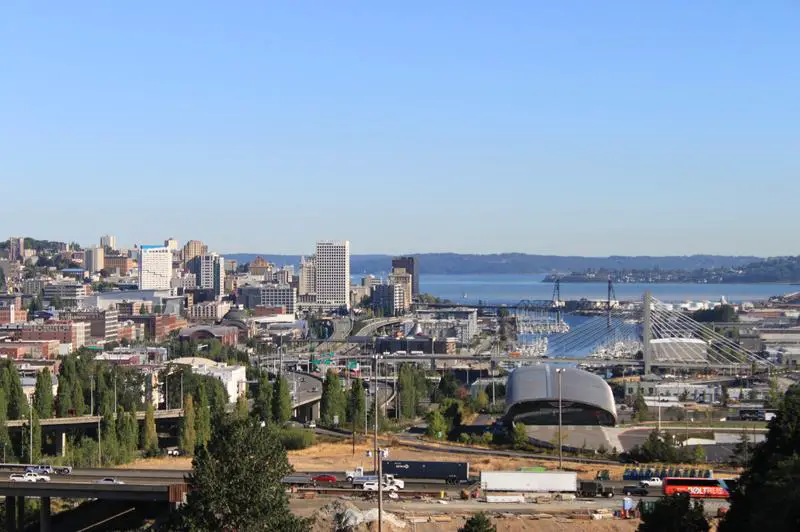
/10
Population: 220,482
% African American: 10.02%
# Of African American Residents: 22,087
Percent Change Since 2010: 0.3%
More on Tacoma: Data
8. Fife
/10
Population: 10,902
% African American: 9.86%
# Of African American Residents: 1,075
Percent Change Since 2010: 20.38%
More on Fife: Data
9. Renton
/10
Population: 105,279
% African American: 8.87%
# Of African American Residents: 9,334
Percent Change Since 2010: 5.61%
More on Renton: Data
10. Lynnwood
/10
Population: 40,953
% African American: 8.69%
# Of African American Residents: 3,557
Percent Change Since 2010: 76.79%
More on Lynnwood: Data
Methodology: How We Determined The Cities In Washington With The Largest Black Population For 2025
We still believe in the accuracy of data — especially from the Census. So that’s where we went to get the race breakdown across Washington.
That leads us to the Census’s most recently available data, the 2019-2023 American Community Survey data from the US Census.
Specifically, we looked at table B03002: Hispanic OR LATINO ORIGIN BY RACE. Here are the category names as defined by the Census:
- Hispanic or Latino
- White alone*
- Black or African American alone*
- American Indian and Alaska Native alone*
- Asian alone*
- Native Hawaiian and Other Pacific Islander alone*
- Some other race alone*
- Two or more races*
Our particular column of interest was the number of people who identified as Black or African American.
We limited our analysis to non-CDPs with a population greater than 6,000 people in Washington. That left us with 115 cities.
We then calculated the percentage of residents that are Black or African American. The percentages ranked from 23.9% to 0.0%.
Finally, we ranked each city based on the percentage of the Black population, with a higher score being more Black than a lower score. SeaTac took the distinction of being the most Black, while Union Gap was the least African American city.
We updated this article for 2025. This is our tenth time ranking the cities in Washington with the largest African American population.
Read on for more information on how the cities in Washington ranked by population of African American residents or, for a more general take on diversity in America, head over to our ranking of the most diverse cities in America.
Summary: Black Populations Across Washington
If you’re looking for a breakdown of African American populations across Washington according to the most recent data, this is an accurate list.
The blackest cities in Washington are SeaTac, Tukwila, Federal Way, Kent, Lakewood, Des Moines, Tacoma, Fife, Renton, and Lynnwood.
If you’re curious enough, here are the least African American places in Washington:
- Union Gap
- Ocean Shores
- Stanwood
For more Washington reading, check out:
- Safest Places In Washington
- Worst Places To Live In Washington
- Cheapest Places To Live In Washington
African American Population By City In Washington
| Rank | City | Population | African American Population | % African American |
|---|---|---|---|---|
| 1 | Seatac | 31,143 | 7,437 | 23.88% |
| 2 | Tukwila | 21,479 | 3,743 | 17.43% |
| 3 | Federal Way | 99,232 | 17,218 | 17.35% |
| 4 | Kent | 135,015 | 17,541 | 12.99% |
| 5 | Lakewood | 63,034 | 8,023 | 12.73% |
| 6 | Des Moines | 32,545 | 3,529 | 10.84% |
| 7 | Tacoma | 220,482 | 22,087 | 10.02% |
| 8 | Fife | 10,902 | 1,075 | 9.86% |
| 9 | Renton | 105,279 | 9,334 | 8.87% |
| 10 | Lynnwood | 40,953 | 3,557 | 8.69% |
| 11 | Auburn | 85,455 | 6,330 | 7.41% |
| 12 | University Place | 34,850 | 2,500 | 7.17% |
| 13 | Burien | 51,331 | 3,571 | 6.96% |
| 14 | Dupont | 9,952 | 675 | 6.78% |
| 15 | Seattle | 741,440 | 48,164 | 6.5% |
| 16 | Brier | 6,507 | 422 | 6.49% |
| 17 | Everett | 111,083 | 7,160 | 6.45% |
| 18 | Airway Heights | 10,766 | 692 | 6.43% |
| 19 | Pacific | 7,064 | 448 | 6.34% |
| 20 | Shoreline | 59,280 | 3,647 | 6.15% |
| 21 | Covington | 20,957 | 1,261 | 6.02% |
| 22 | Lacey | 57,088 | 3,379 | 5.92% |
| 23 | Oak Harbor | 24,396 | 1,326 | 5.44% |
| 24 | Yelm | 10,618 | 521 | 4.91% |
| 25 | Mill Creek | 20,846 | 924 | 4.43% |
| 26 | Bremerton | 44,531 | 1,941 | 4.36% |
| 27 | Steilacoom | 6,683 | 290 | 4.34% |
| 28 | Lake Forest Park | 13,356 | 556 | 4.16% |
| 29 | Puyallup | 42,642 | 1,725 | 4.05% |
| 30 | Fircrest | 7,082 | 268 | 3.78% |
| 31 | Mountlake Terrace | 21,419 | 774 | 3.61% |
| 32 | Tumwater | 26,519 | 947 | 3.57% |
| 33 | Monroe | 19,696 | 689 | 3.5% |
| 34 | Kenmore | 23,594 | 714 | 3.03% |
| 35 | Vancouver | 192,696 | 5,694 | 2.95% |
| 36 | Cheney | 12,830 | 341 | 2.66% |
| 37 | Edgewood | 12,683 | 337 | 2.66% |
| 38 | Moses Lake | 25,594 | 669 | 2.61% |
| 39 | Spokane | 229,228 | 5,914 | 2.58% |
| 40 | Walla Walla | 33,766 | 870 | 2.58% |
| 41 | Poulsbo | 11,962 | 301 | 2.52% |
| 42 | Marysville | 71,570 | 1,783 | 2.49% |
| 43 | Olympia | 55,583 | 1,365 | 2.46% |
| 44 | Aberdeen | 17,040 | 413 | 2.42% |
| 45 | Milton | 8,747 | 205 | 2.34% |
| 46 | Lake Stevens | 39,500 | 894 | 2.26% |
| 47 | Edmonds | 42,783 | 950 | 2.22% |
| 48 | Bellevue | 151,199 | 3,247 | 2.15% |
| 49 | Redmond | 75,721 | 1,612 | 2.13% |
| 50 | Woodinville | 13,440 | 276 | 2.05% |
| 51 | Sequim | 8,130 | 165 | 2.03% |
| 52 | Kennewick | 84,389 | 1,701 | 2.02% |
| 53 | Clarkston | 7,240 | 145 | 2.0% |
| 54 | Maple Valley | 28,121 | 528 | 1.88% |
| 55 | Pasco | 78,446 | 1,470 | 1.87% |
| 56 | Pullman | 31,939 | 578 | 1.81% |
| 57 | Ellensburg | 18,913 | 339 | 1.79% |
| 58 | Kelso | 12,697 | 208 | 1.64% |
| 59 | Issaquah | 39,472 | 644 | 1.63% |
| 60 | Burlington | 9,637 | 157 | 1.63% |
| 61 | Camas | 26,779 | 435 | 1.62% |
| 62 | Newcastle | 12,945 | 203 | 1.57% |
| 63 | Kirkland | 91,614 | 1,417 | 1.55% |
| 64 | Sammamish | 66,375 | 1,014 | 1.53% |
| 65 | Yakima | 96,810 | 1,389 | 1.43% |
| 66 | Woodland | 6,513 | 93 | 1.43% |
| 67 | Mercer Island | 25,282 | 345 | 1.36% |
| 68 | Arlington | 20,599 | 274 | 1.33% |
| 69 | Mount Vernon | 35,312 | 469 | 1.33% |
| 70 | Chehalis | 7,536 | 100 | 1.33% |
| 71 | Spokane Valley | 105,460 | 1,381 | 1.31% |
| 72 | Mukilteo | 21,312 | 278 | 1.3% |
| 73 | Richland | 61,912 | 774 | 1.25% |
| 74 | Bellingham | 92,367 | 1,128 | 1.22% |
| 75 | Port Orchard | 16,398 | 197 | 1.2% |
| 76 | Bonney Lake | 22,776 | 259 | 1.14% |
| 77 | Normandy Park | 6,659 | 72 | 1.08% |
| 78 | Centralia | 18,457 | 194 | 1.05% |
| 79 | Sumner | 10,674 | 105 | 0.98% |
| 80 | Port Angeles | 20,087 | 197 | 0.98% |
| 81 | Wenatchee | 35,502 | 328 | 0.92% |
| 82 | Longview | 37,836 | 330 | 0.87% |
| 83 | Bothell | 48,610 | 416 | 0.86% |
| 84 | Selah | 8,301 | 69 | 0.83% |
| 85 | Snoqualmie | 13,750 | 114 | 0.83% |
| 86 | West Richland | 17,126 | 141 | 0.82% |
| 87 | Orting | 8,957 | 69 | 0.77% |
| 88 | Ephrata | 8,493 | 65 | 0.77% |
| 89 | Lynden | 16,025 | 119 | 0.74% |
| 90 | Port Townsend | 10,290 | 75 | 0.73% |
| 91 | Quincy | 7,922 | 54 | 0.68% |
| 92 | Gig Harbor | 12,202 | 79 | 0.65% |
| 93 | Duvall | 8,279 | 51 | 0.62% |
| 94 | Washougal | 16,945 | 103 | 0.61% |
| 95 | Snohomish | 10,177 | 61 | 0.6% |
| 96 | Battle Ground | 21,293 | 124 | 0.58% |
| 97 | College Place | 9,828 | 56 | 0.57% |
| 98 | Anacortes | 17,837 | 88 | 0.49% |
| 99 | Sedro-Woolley | 12,633 | 59 | 0.47% |
| 100 | Enumclaw | 12,663 | 59 | 0.47% |
I think you missed the city of Silverdale.
Population of 19,204 in 2010 census
% African American = 3.24% in 2010 census