
Most African American cities in West Virginia research summary. We used Saturday Night Science to analyze West Virginia’s most recent Census data to determine the blackest cities in West Virginia based on the percentage of Black residents. Here are the results of our analysis:
-
The city with the largest African American population in West Virginia is Bluefield based on the most recent Census data.
-
Bluefield is 15.0% Black.
-
The least African American city in West Virginia is Hurricane.
-
Hurricane is 0.15% Black.
-
West Virginia is 3.2% Black.
-
West Virginia is the 37th blackest state in the United States.
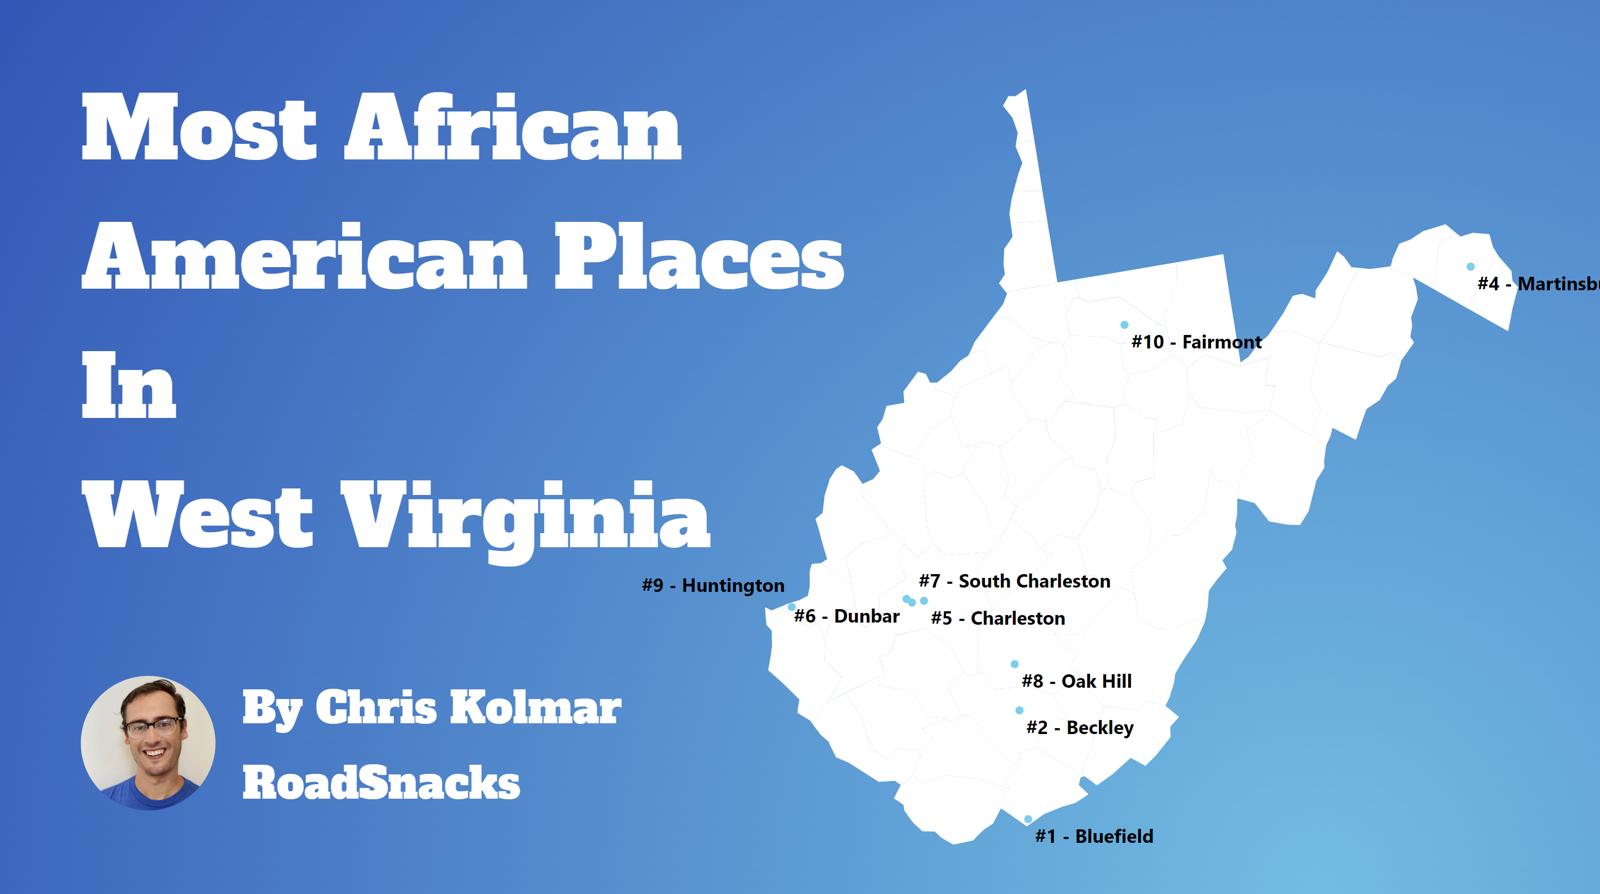
Table Of Contents: Top Ten | Methodology | Summary | Table
The Black community is one of the fastest-growing communities in America this decade.
Roughly 42 million people identifying as Black or African American live in the United States, making up 12% of the total population. According to the most recent American Community Survey, the Black population in West Virginia is 57,299 – at 3.2% of the total population of West Virginia.
The percentage growth of Blacks in America is the third largest percentage change for any race according to the Census’s race and ethnicity definition. Most scholars and historians agree that increasing diversity in America is a good thing.
We agree.
But how has the increase in the black population impacted West Virginia? Which cities and towns in West Virginia have seen the greatest increase in its Black population?
We broke down the most recent census data to determine the cities in West Virginia with the largest African American population in 2025:
Most African American Places In West Virginia
What’s the blackest city in West Virginia? The city with the largest Black population in West Virginia for 2025 is Bluefield. See if Bluefield ranked as one of the most african american places in America.
And if you already knew these places were Black, check out the best places to live in West Virginia or the most diverse places in West Virginia.
The 10 Blackest Cities In West Virginia For 2025
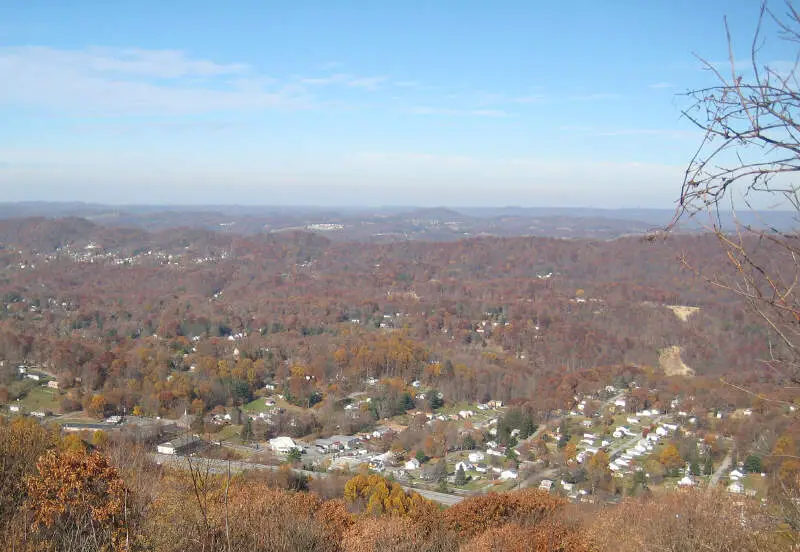
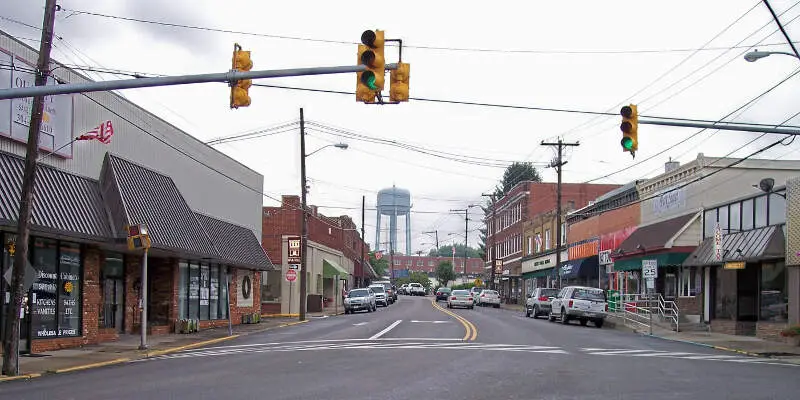
1. Bluefield
/10
Population: 9,511
% African American: 15.0%
# Of African American Residents: 1,427
Percent Change Since 2010: -41.37%
More on Bluefield: Data
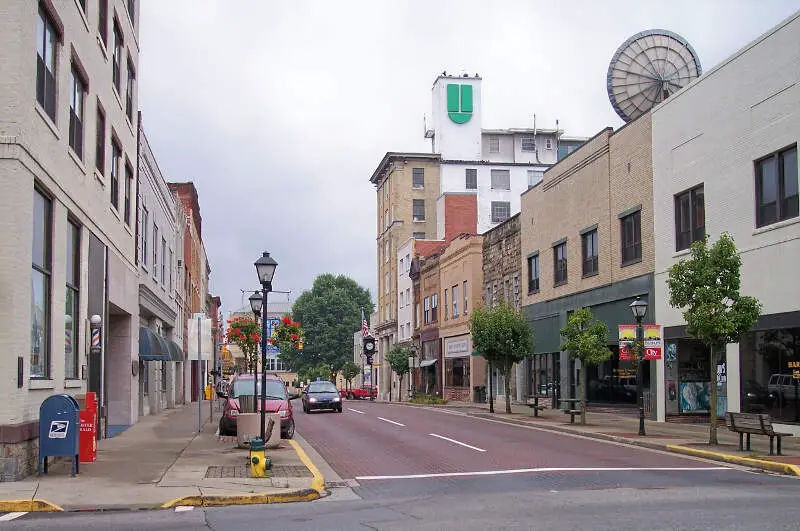
2. Beckley
/10
Population: 16,977
% African American: 15.0%
# Of African American Residents: 2,546
Percent Change Since 2010: -31.28%
More on Beckley: Data
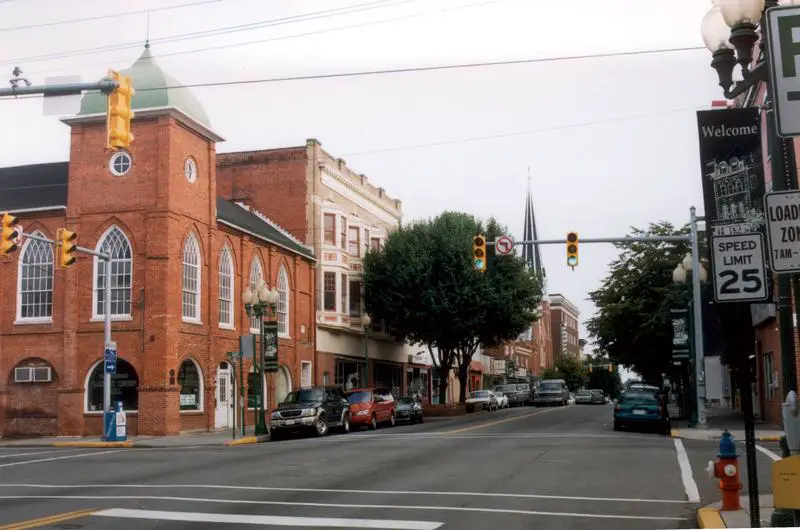
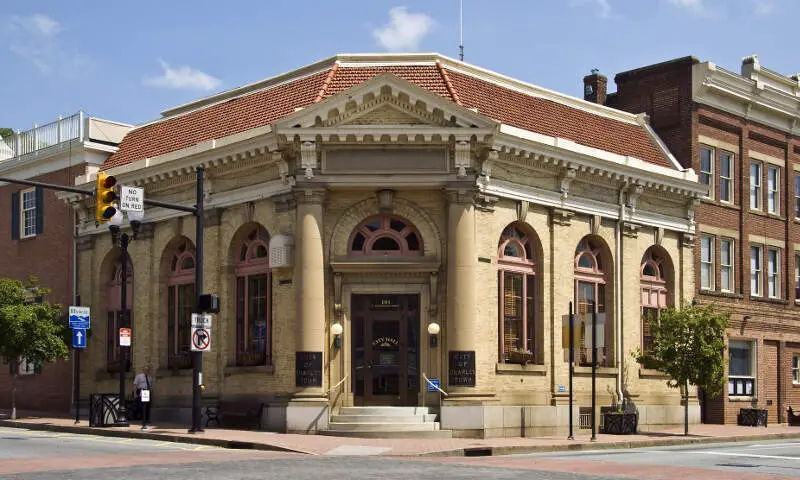
3. Martinsburg
/10
Population: 18,805
% African American: 13.54%
# Of African American Residents: 2,546
Percent Change Since 2010: 31.64%
More on Martinsburg: Data
4. Dunbar
/10
Population: 7,340
% African American: 12.19%
# Of African American Residents: 895
Percent Change Since 2010: 36.85%
More on Dunbar: Data
5. Charles Town
/10
Population: 6,854
% African American: 12.1%
# Of African American Residents: 829
Percent Change Since 2010: -6.12%
More on Charles Town: Data
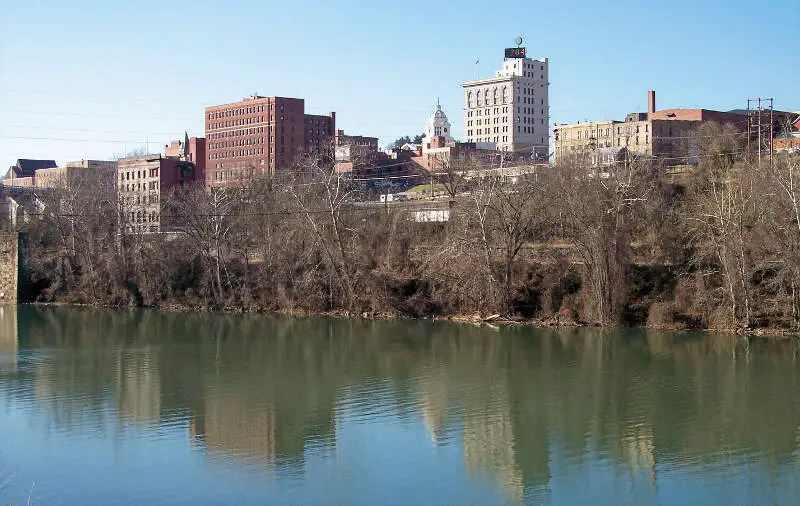
6. Charleston
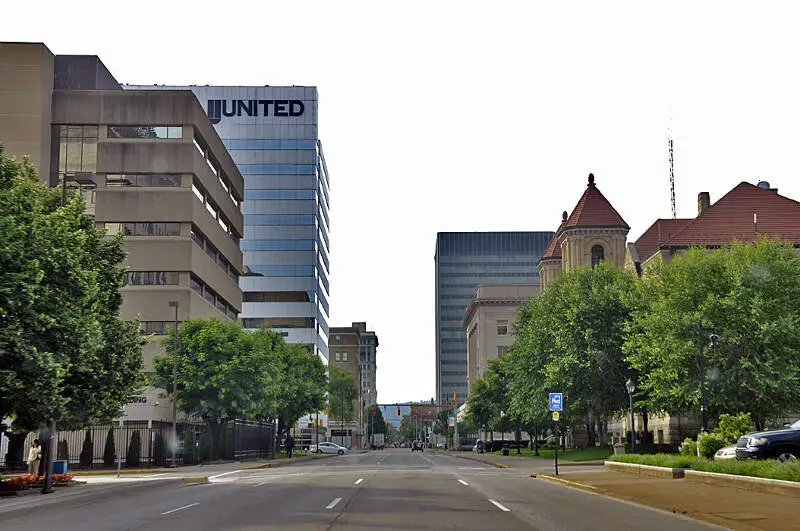
/10
Population: 47,918
% African American: 11.77%
# Of African American Residents: 5,640
Percent Change Since 2010: 9.64%
More on Charleston: Data
7. South Charleston
/10
Population: 13,594
% African American: 7.39%
# Of African American Residents: 1,005
Percent Change Since 2010: 1.31%
More on South Charleston: Data
8. Oak Hill
/10
Population: 8,057
% African American: 7.14%
# Of African American Residents: 575
Percent Change Since 2010: 16.87%
More on Oak Hill: Data
9. Fairmont
/10
Population: 18,303
% African American: 6.21%
# Of African American Residents: 1,137
Percent Change Since 2010: -21.59%
More on Fairmont: Data
10. Huntington
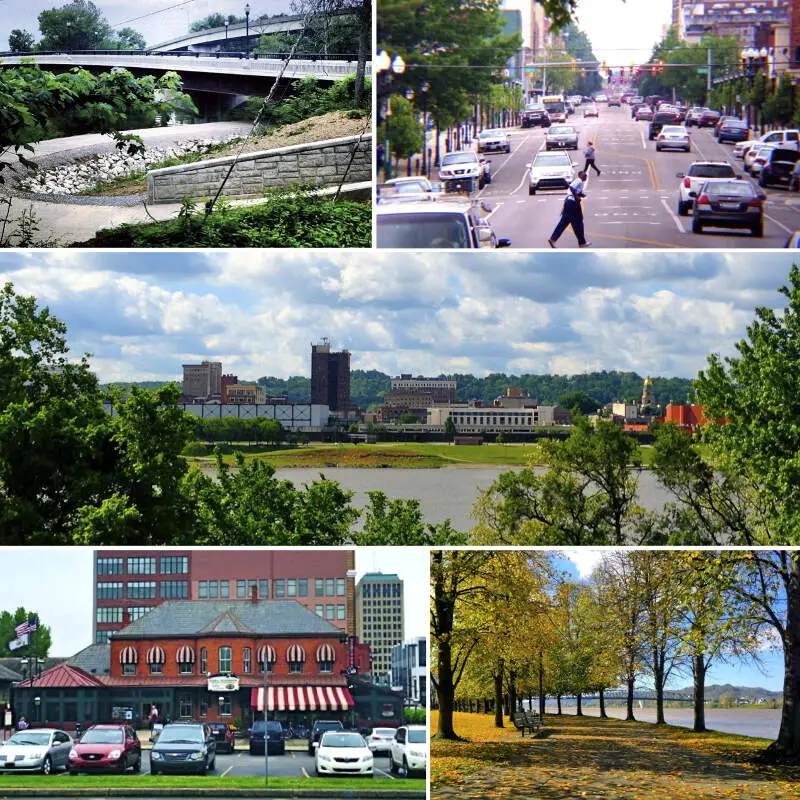
/10
Population: 46,189
% African American: 6.2%
# Of African American Residents: 2,865
Percent Change Since 2010: -28.94%
More on Huntington: Data
Methodology: How We Determined The Cities In West Virginia With The Largest Black Population For 2025
We still believe in the accuracy of data — especially from the Census. So that’s where we went to get the race breakdown across West Virginia.
That leads us to the Census’s most recently available data, the 2019-2023 American Community Survey data from the US Census.
Specifically, we looked at table B03002: Hispanic OR LATINO ORIGIN BY RACE. Here are the category names as defined by the Census:
- Hispanic or Latino
- White alone*
- Black or African American alone*
- American Indian and Alaska Native alone*
- Asian alone*
- Native Hawaiian and Other Pacific Islander alone*
- Some other race alone*
- Two or more races*
Our particular column of interest was the number of people who identified as Black or African American.
We limited our analysis to non-CDPs with a population greater than 5,000 people in West Virginia. That left us with 25 cities.
We then calculated the percentage of residents that are Black or African American. The percentages ranked from 15.0% to 0.1%.
Finally, we ranked each city based on the percentage of the Black population, with a higher score being more Black than a lower score. Bluefield took the distinction of being the most Black, while Hurricane was the least African American city.
We updated this article for 2025. This is our tenth time ranking the cities in West Virginia with the largest African American population.
Read on for more information on how the cities in West Virginia ranked by population of African American residents or, for a more general take on diversity in America, head over to our ranking of the most diverse cities in America.
Summary: Black Populations Across West Virginia
If you’re looking for a breakdown of African American populations across West Virginia according to the most recent data, this is an accurate list.
The blackest cities in West Virginia are Bluefield, Beckley, Martinsburg, Dunbar, Charles Town, Charleston, South Charleston, Oak Hill, Fairmont, and Huntington.
If you’re curious enough, here are the least African American places in West Virginia:
- Hurricane
- Moundsville
- New Martinsville
For more West Virginia reading, check out:
- Worst Places To Live In West Virginia
- Most Dangerous Cities In West Virginia
- Best Places To Live In West Virginia
African American Population By City In West Virginia
| Rank | City | Population | African American Population | % African American |
|---|---|---|---|---|
| 1 | Bluefield | 9,511 | 1,427 | 15.0% |
| 2 | Beckley | 16,977 | 2,546 | 15.0% |
| 3 | Martinsburg | 18,805 | 2,546 | 13.54% |
| 4 | Dunbar | 7,340 | 895 | 12.19% |
| 5 | Charles Town | 6,854 | 829 | 12.1% |
| 6 | Charleston | 47,918 | 5,640 | 11.77% |
| 7 | South Charleston | 13,594 | 1,005 | 7.39% |
| 8 | Oak Hill | 8,057 | 575 | 7.14% |
| 9 | Fairmont | 18,303 | 1,137 | 6.21% |
| 10 | Huntington | 46,189 | 2,865 | 6.2% |
| 11 | Buckhannon | 5,144 | 302 | 5.87% |
| 12 | St. Albans | 10,637 | 622 | 5.85% |
| 13 | Wheeling | 26,670 | 1,179 | 4.42% |
| 14 | Morgantown | 30,273 | 1,264 | 4.18% |
| 15 | Princeton | 5,780 | 235 | 4.07% |
| 16 | Elkins | 6,875 | 199 | 2.89% |
| 17 | Clarksburg | 15,829 | 449 | 2.84% |
| 18 | Weirton | 18,785 | 506 | 2.69% |
| 19 | Vienna | 10,575 | 260 | 2.46% |
| 20 | Bridgeport | 9,292 | 150 | 1.61% |
| 21 | Nitro | 6,941 | 101 | 1.46% |
| 22 | Parkersburg | 29,461 | 410 | 1.39% |
| 23 | New Martinsville | 5,175 | 55 | 1.06% |
| 24 | Moundsville | 7,934 | 14 | 0.18% |
| 25 | Hurricane | 6,891 | 10 | 0.15% |
Why r u looking at the places with the most blacks???