
Americans are really smart. Some are just smarter than others.
And today, we will focus on the other Americans, the dumb ones.
More precisely, what cities in the U.S. are the dumbest.
How do you decide which city in the U.S. is the dumbest? We used Saturday Night Science to measure the high school graduation rate and the rates of college completion for adults by city. We used those criteria to create an index and then ranked the cities based on the index.
And if you’re lost now, chances are you live in one of the locations listed below.
Table Of Contents: Top Ten | Methodology | Summary | Table
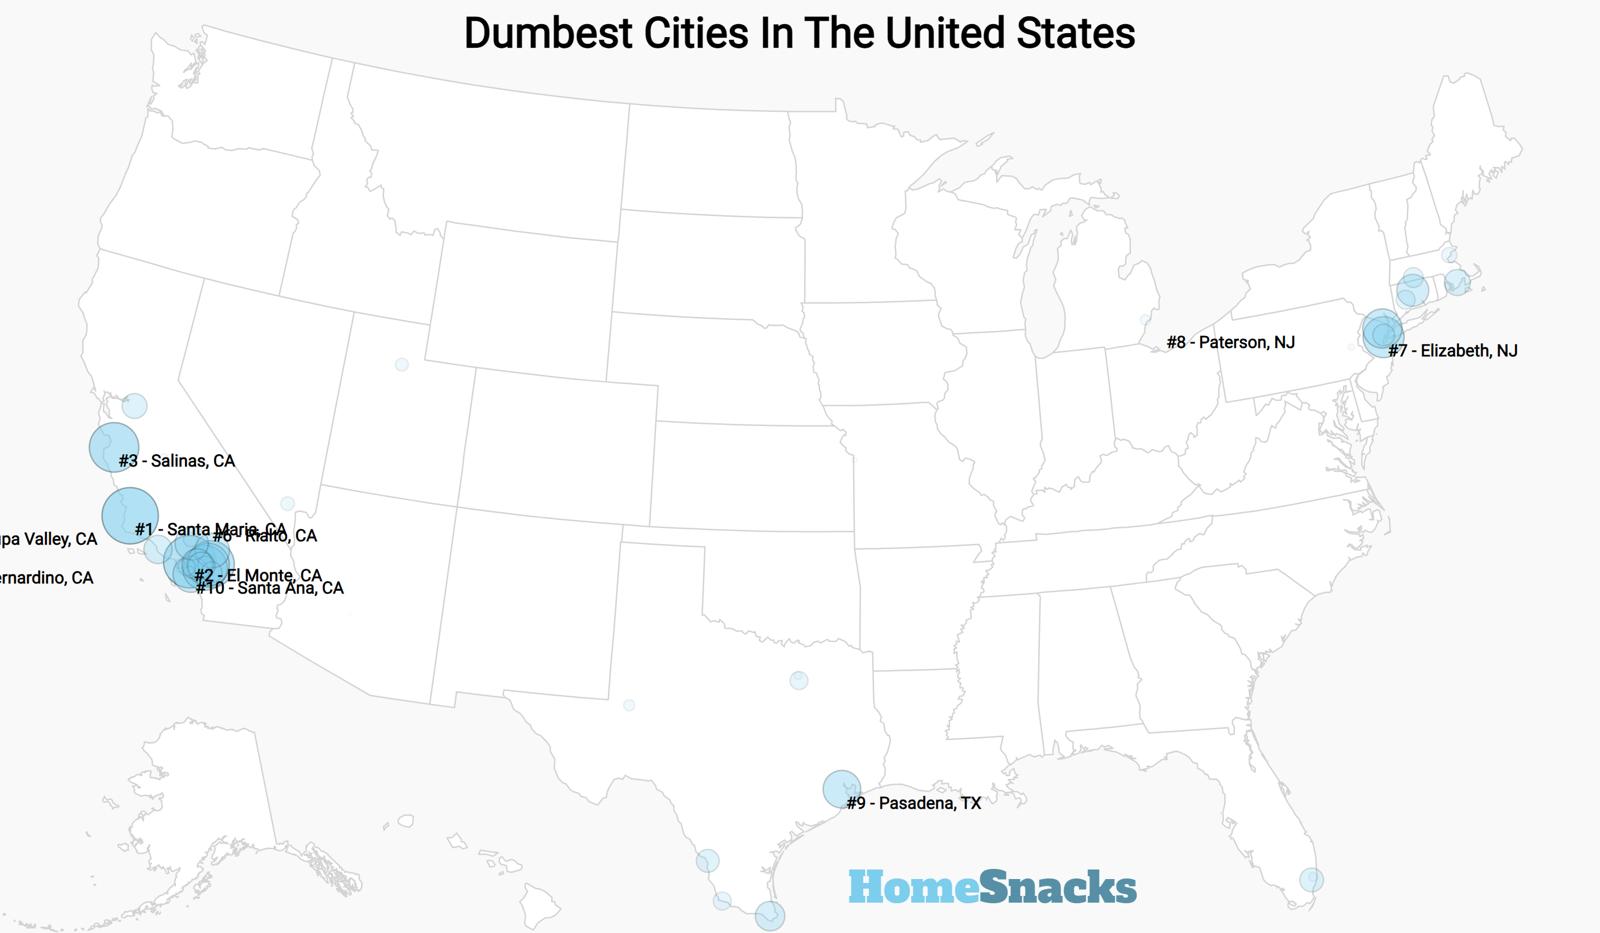
The 10 Dumbest Cities In The US For 2025
Are we seeing a pattern here? Almost all the cities on this list are in California and Texas.
Also, we’re not saying the people in these cities â or the cities themselves â are bad. We’re just observing that they’re not the brightest bulbs in the room.
And it’s all in good fun, so don’t break the mood.
Related Reading:
- Worst Places To Live In America
- Cheapest Cities By State
- Cheapest States To Live In
- Best Places By State
- Safest Cities By State
The 10 Dumbest Cities In America For 2025

/10
Population: 107,066
Adult High School Dropout: 36.0% (2nd worst)
Adult Highly Educated: 14.0% (6th worst)
More on El Monte: Data
El Monte is just a bit east of Los Angeles. Here, 47% of the residents are high school dropouts. There are 10 bars for every library here. In fact, there aren’t very many libraries at all in El Monte.
We’re not saying that a lack of libraries is a sign that people are stupid. We get it: Lots of people don’t attend libraries, and you can learn anything you want on the web. That’s if you have the web. There are large percentages of every large city that don’t have a computer or internet, and rely on a library in which to learn.
And that would be really tough in El Monte.


/10
Population: 161,993
Adult High School Dropout: 39.0% (worst)
Adult Highly Educated: 15.0% (9th worst)
More on Salinas: Data
So here’s the deal with Salinas: It has one of the nation’s highest number of uneducated residents. That’s a fact. But the library to bar ratio is actually respectable. There are quite a few libraries in town here.
For that reason, we’re arguing that there’s no excuse that such a large percentage of the population remains uneducated. Like quite a few other cities on this list, Salinas is a huge agricultural town, and it has one of the largest concentrations of illegal immigrants in the nation.


/10
Population: 109,880
Adult High School Dropout: 36.0% (3rd worst)
Adult Highly Educated: 15.0% (9th worst)
More on Santa Maria: Data


/10
Population: 135,887
Adult High School Dropout: 26.0% (10th worst)
Adult Highly Educated: 14.0% (6th worst)
More on Elizabeth: Data
New Jersey isn’t known for its geniuses. Think of the Garden State and you conjure images of the Jersey Shore or the Sopranos. With that in mind, it’s not surprising that a couple New Jersey cities make this particular list.
The second Jersey entry comes from Elizabeth, a town of 135887 residents located just south of Newark. In fact, part of the Newark airport is located in Elizabeth…all those fumes probably don’t help.


/10
Population: 103,866
Adult High School Dropout: 24.0% (13th worst)
Adult Highly Educated: 13.0% (4th worst)
More on Rialto: Data


/10
Population: 135,983
Adult High School Dropout: 24.0% (16th worst)
Adult Highly Educated: 12.0% (2nd worst)
More on Victorville: Data

/10
Population: 157,660
Adult High School Dropout: 24.0% (16th worst)
Adult Highly Educated: 12.0% (3rd worst)
More on Paterson: Data

/10
Population: 106,244
Adult High School Dropout: 26.0% (10th worst)
Adult Highly Educated: 16.0% (12th worst)
More on Jurupa Valley: Data


/10
Population: 311,639
Adult High School Dropout: 34.0% (4th worst)
Adult Highly Educated: 18.0% (18th worst)
More on Santa Ana: Data
When you have 22 bars for every library, and half of the people in your city are walking around without a high school education, that’s a sign that your town is lacking some real intelligence.
While we’re not judging the individual intelligence level of anyone in Santa Ana in particular, it’s clear there’s not a lot upstairs with many, many people here.
Santa Ana is centrally located in Orange County, and it’s considered one of the most densely populated cities in the country.

/10
Population: 100,141
Adult High School Dropout: 23.0% (22nd worst)
Adult Highly Educated: 12.0% (2nd worst)
More on Hesperia: Data
Methodology: What stupid criteria did we use?
In order to rank the dumbest cities in the USA of A, we used Saturday Night Science to find the least educated cities.
We started by making a list of every place in the U.S. with over 100,000 people based on the 2019-2023 American Community Survey. That left us with 322 places to rank.
We then looked at the following dumb-tastic criteria for each of the places on the list:
- % of the city’s population with less than a high school education (Age 25+)
- % of city’s population without a college degree (Age 25+)
We updated this article for 2025. This is our tenth time ranking the dumbest cities to live in America. This article is an opinion based on facts and is meant as infotainment — don’t freak out.
There You Have It — The Dumbest Big Cities in America
If you’re measuring the locations in America with many dropouts, few libraries, and where people tend to be less educated, this is an accurate list.
The dumbest cities in the United States are El Monte, CA, Salinas, CA, Santa Maria, CA, Elizabeth, NJ, Rialto, CA, Victorville, CA, Paterson, NJ, Jurupa Valley, CA, Santa Ana, CA, and Hesperia, CA.
If you’re curious enough, here are the least stupid places in America. Or, the smartest, if you will:
- Carmel
- Sandy Springs
- Berkeley
The Dumbest Cities In America
| Rank | City | Population | Adult High School Dropout | Adult Highly Educated |
|---|---|---|---|---|
| 1 | El Monte, CA | 107,066 | 36.0% | 14.0% |
| 2 | Salinas, CA | 161,993 | 39.0% | 15.0% |
| 3 | Santa Maria, CA | 109,880 | 36.0% | 15.0% |
| 4 | Elizabeth, NJ | 135,887 | 26.0% | 14.0% |
| 5 | Rialto, CA | 103,866 | 24.0% | 13.0% |
| 6 | Victorville, CA | 135,983 | 24.0% | 12.0% |
| 7 | Paterson, NJ | 157,660 | 24.0% | 12.0% |
| 8 | Jurupa Valley, CA | 106,244 | 26.0% | 16.0% |
| 9 | Santa Ana, CA | 311,639 | 34.0% | 18.0% |
| 10 | Hesperia, CA | 100,141 | 23.0% | 12.0% |
| 11 | Pasadena, TX | 149,345 | 26.0% | 17.0% |
| 12 | San Bernardino, CA | 221,774 | 24.0% | 14.0% |
| 13 | Hartford, CT | 119,970 | 26.0% | 18.0% |
| 14 | Oxnard, CA | 201,014 | 31.0% | 20.0% |
| 15 | Palmdale, CA | 165,487 | 23.0% | 16.0% |
| 16 | Laredo, TX | 255,949 | 30.0% | 21.0% |
| 17 | New Bedford, MA | 100,731 | 23.0% | 18.0% |
| 18 | Pomona, CA | 148,391 | 25.0% | 20.0% |
| 19 | Stockton, CA | 320,470 | 23.0% | 19.0% |
| 20 | Newark, NJ | 307,188 | 22.0% | 18.0% |
| 21 | West Valley City, UT | 137,955 | 19.0% | 15.0% |
| 22 | Brownsville, TX | 188,023 | 30.0% | 22.0% |
| 23 | Hialeah, FL | 221,901 | 24.0% | 22.0% |
| 24 | Moreno Valley, CA | 210,378 | 19.0% | 17.0% |
| 25 | Waterbury, CT | 114,356 | 19.0% | 17.0% |
| 26 | Springfield, MA | 154,751 | 20.0% | 20.0% |
| 27 | Ontario, CA | 178,347 | 21.0% | 21.0% |
| 28 | Mesquite, TX | 148,848 | 19.0% | 19.0% |
| 29 | Norwalk, CA | 100,713 | 22.0% | 22.0% |
| 30 | Fontana, CA | 211,921 | 20.0% | 21.0% |
| 31 | Odessa, TX | 114,080 | 18.0% | 19.0% |
| 32 | Inglewood, CA | 105,575 | 23.0% | 24.0% |
| 33 | Detroit, MI | 636,644 | 17.0% | 18.0% |
| 34 | Lynn, MA | 100,905 | 22.0% | 24.0% |
| 35 | Garden Grove, CA | 170,603 | 24.0% | 25.0% |
| 36 | Allentown, PA | 125,320 | 18.0% | 20.0% |
| 37 | Bridgeport, CT | 148,012 | 21.0% | 24.0% |
| 38 | Kansas City, KS | 154,776 | 18.0% | 21.0% |
| 39 | Miami Gardens, FL | 111,264 | 16.0% | 18.0% |
| 40 | North Las Vegas, NV | 270,773 | 16.0% | 19.0% |
| 41 | Garland, TX | 245,298 | 20.0% | 25.0% |
| 42 | Lancaster, CA | 170,013 | 16.0% | 21.0% |
| 43 | Brockton, MA | 105,080 | 17.0% | 22.0% |
| 44 | Fresno, CA | 543,615 | 20.0% | 25.0% |
| 45 | Modesto, CA | 218,614 | 16.0% | 21.0% |
| 46 | El Cajon, CA | 104,909 | 16.0% | 22.0% |
| 47 | Elgin, IL | 114,106 | 19.0% | 26.0% |
| 48 | Cleveland, OH | 367,523 | 16.0% | 22.0% |
| 49 | Bakersfield, CA | 408,366 | 17.0% | 24.0% |
| 50 | Glendale, AZ | 250,193 | 16.0% | 23.0% |
| 51 | El Paso, TX | 678,147 | 19.0% | 27.0% |
| 52 | Escondido, CA | 149,913 | 20.0% | 28.0% |
| 53 | Downey, CA | 111,793 | 18.0% | 26.0% |
| 54 | Anaheim, CA | 344,553 | 22.0% | 29.0% |
| 55 | Riverside, CA | 316,241 | 17.0% | 26.0% |
| 56 | Joliet, IL | 149,785 | 16.0% | 25.0% |
| 57 | Antioch, CA | 115,759 | 15.0% | 24.0% |
| 58 | Greeley, CO | 109,421 | 17.0% | 27.0% |
| 59 | Warren, MI | 138,128 | 13.0% | 20.0% |
| 60 | Edinburg, TX | 102,561 | 19.0% | 29.0% |
| 61 | Grand Prairie, TX | 198,564 | 19.0% | 29.0% |
| 62 | Corpus Christi, TX | 317,383 | 14.0% | 24.0% |
| 63 | Wichita Falls, TX | 102,558 | 14.0% | 24.0% |
| 64 | Rockford, IL | 147,649 | 14.0% | 24.0% |
| 65 | Beaumont, TX | 113,710 | 14.0% | 24.0% |
| 66 | Milwaukee, WI | 569,756 | 15.0% | 26.0% |
| 67 | Dayton, OH | 136,741 | 12.0% | 21.0% |
| 68 | Amarillo, TX | 200,945 | 14.0% | 25.0% |
| 69 | Visalia, CA | 142,649 | 13.0% | 23.0% |
| 70 | Gresham, OR | 112,818 | 13.0% | 24.0% |
| 71 | West Covina, CA | 107,436 | 16.0% | 29.0% |
| 72 | San Antonio, TX | 1,458,954 | 15.0% | 29.0% |
| 73 | Lowell, MA | 114,799 | 16.0% | 30.0% |
| 74 | Las Vegas, NV | 650,873 | 14.0% | 27.0% |
| 75 | Mcallen, TX | 143,789 | 19.0% | 32.0% |
| 76 | Richmond, CA | 115,396 | 20.0% | 33.0% |
| 77 | Waco, TX | 141,925 | 14.0% | 28.0% |
| 78 | Jackson, MS | 149,827 | 14.0% | 28.0% |
| 79 | Akron, OH | 189,526 | 12.0% | 23.0% |
| 80 | Hayward, CA | 159,201 | 18.0% | 32.0% |
| 81 | Augusta-Richmond County Consolidated Government (Balance), GA | 201,504 | 12.0% | 24.0% |
| 82 | Evansville, IN | 116,441 | 11.0% | 22.0% |
| 83 | Toledo, OH | 268,461 | 11.0% | 22.0% |
| 84 | Green Bay, WI | 106,585 | 12.0% | 25.0% |
| 85 | North Charleston, SC | 117,460 | 13.0% | 28.0% |
| 86 | Miami, FL | 446,663 | 20.0% | 35.0% |
| 87 | Providence, RI | 190,214 | 19.0% | 34.0% |
| 88 | Fort Worth, TX | 941,311 | 16.0% | 32.0% |
| 89 | Phoenix, AZ | 1,624,832 | 16.0% | 32.0% |
| 90 | Syracuse, NY | 146,211 | 15.0% | 30.0% |
| 91 | Rochester, NY | 209,720 | 15.0% | 30.0% |
| 92 | Kent, WA | 135,015 | 13.0% | 29.0% |
| 93 | Pompano Beach, FL | 112,212 | 15.0% | 31.0% |
| 94 | Pueblo, CO | 111,514 | 11.0% | 23.0% |
| 95 | Menifee, CA | 107,020 | 11.0% | 23.0% |
| 96 | Sparks, NV | 109,106 | 12.0% | 26.0% |
| 97 | Des Moines, IA | 212,464 | 13.0% | 29.0% |
| 98 | South Bend, IN | 102,866 | 13.0% | 29.0% |
| 99 | Fairfield, CA | 119,985 | 12.0% | 27.0% |
| 100 | Corona, CA | 158,839 | 14.0% | 31.0% |
Dumbest Places By State
The 10 Dumbest Places In Alabama For 2025
The 10 Dumbest Places In Arizona For 2025
The 10 Dumbest Places In Arkansas For 2025
The 10 Dumbest Places In Georgia For 2025
The 10 Dumbest Places In Massachusetts For 2025
The 10 Dumbest Places In Michigan For 2025
The 10 Dumbest Places In Minnesota For 2025
The 10 Dumbest Places In Mississippi For 2025
The 10 Dumbest Places In Missouri For 2025
The 10 Dumbest Places In Montana For 2025
The 10 Dumbest Places In Nebraska For 2025
The 10 Dumbest Places In New York For 2025
The 10 Dumbest Places In North Carolina For 2025
The 10 Dumbest Places In Oregon For 2025
The 10 Dumbest Places In Tennessee For 2025
The 10 Dumbest Places In South Carolina For 2025
The 10 Dumbest Places In West Virginia For 2025
The 10 Dumbest States In The United States For 2024
The 10 Dumbest Places In California For 2025
The 10 Dumbest Places In Connecticut For 2025
The 10 Dumbest Places In Illinois For 2025
The 10 Dumbest Places In Indiana For 2025
The 10 Dumbest Places In Iowa For 2025
The 10 Dumbest Places In Kansas For 2025
The 10 Dumbest Places In Kentucky For 2025
The 10 Dumbest Places In Louisiana For 2025
The 10 Dumbest Places In Maryland For 2025
The 10 Dumbest Places In Ohio For 2025
The 10 Dumbest Places In Oklahoma For 2025
The 10 Dumbest Places In Pennsylvania For 2025
I believe you have failed to consider that many of the “high school dropouts” in El Monte are immigrants who had limited educational opportunities in their native countries and who, more importantly, risked life and limb to bring their children to our country so that their children would have a better chance at an education.
These are some of the smartest people you’ll ever meet, and I’m honored to serve these people of courage, self-sacrifice, and perseverance as a teacher in El Monte.
Bolches yarboclos…
Dumb and dumber you go.
I really don’t understand what sex has to to with the average intelligence of a city. Sure, more women than men are graduating from the college and high school level, but that statistic was clearly covered by the high school graduation rate, which is really the only statistic that matters in this survey as far as getting an estimate on an IQ median of a population is concerned. I just can’t help but wonder if the author simply wants to degrade men for the sake of it. It feels like reading about the poverty of a city being attributed to the number of blacks or latinos/hispanics found in the specified city instead of the economic conditions in which many of them work. Yep. Pretty offensive and illogical stuff.
I is fum conntickut and yous aint know nothing bout ratio impmalcemt
from google : a ratio is a relationship between two numbers indicating how many times the first number contains the second.[1] For example, if a bowl of fruit contains eight oranges and six lemons, then the ratio of oranges to lemons is eight to six (that is, 8:6, which is equivalent to the ratio 4:3). PRICK
Dumb-tastic criteria = Number of men in a city
Are you kidding me?
Why is sexism OK when it’s directed at men?
Sex rate? Carrie White (the author) is a dumb *itch.
I need to share this offensive, racist, bigoted article. Must be a Trump supporter!
Oxnard actually has 3 public libraries.
Most of the reason Oxnard is so uneducated is the number of farm workers in the area.
Heavy sigh. *facepalm*
This article is an opinion based on facts and is meant as infotainment. Don’t freak out.
Obviously any of the people who are triggered did not read this. Also, I am from Santa Ana and I totally agree with it because there are so many people who just do not try even though they are given all the opportunities.
They factoring population of men because factually Women are Smarter than men so the more men you have in that City if it’s over 50% basically it’s saying with the fact that women are statistically smarter than men depending on how many men live there is going to make that City not as intelligent as others
ATTN EASILY OFFENDED
1) it’s a fun study using publicly updated Wikipedia as a source. NOT SCIENTIFIC
2) Illegal aliens bring down the literacy rates. It’s not profiling, it’s a FACT. Mexico doesn’t ship its best & brightest to the US! They don’t want the unskilled! (they’re the smart ones)
3) How stupid can you be to NOT attract WOMEN to your town! Unless it’s a White Party, no one likes a sausage fest