
You might think people across the nation love where they live. After all, you wouldn’t spend your life somewhere you truly didn’t love. Right?
Wrong.
In fact, almost half of Americans would rather live somewhere else than they do now. If you’re in one of the counties we’re about to highlight, we don’t blame you for wanting to move.
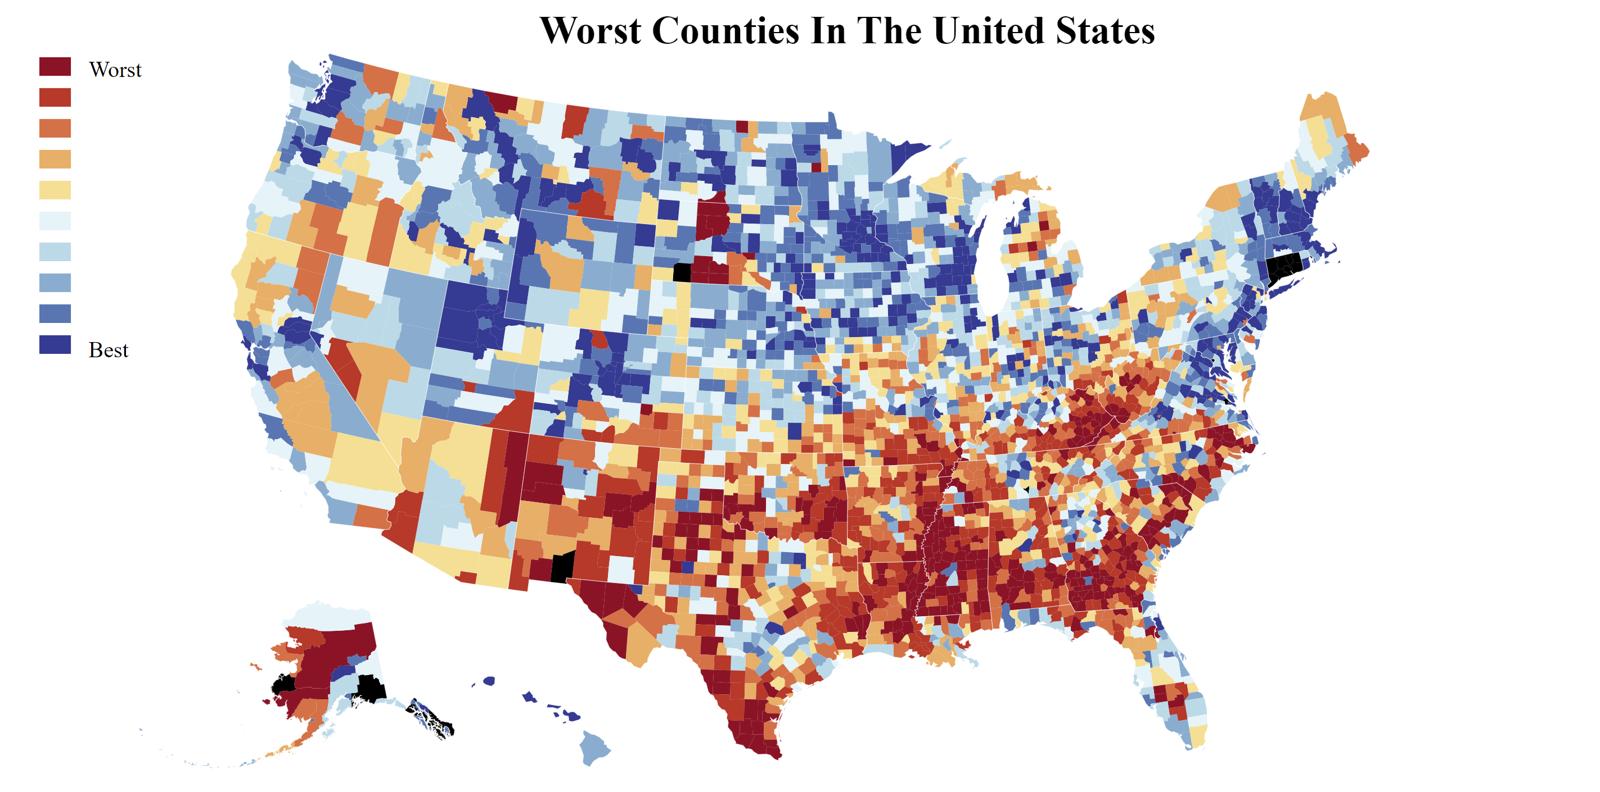
After analyzing all 3,125 counties in the United States using Saturday Night Science, we came up with this set of the ten worst counties in our nation with a population over 100,000. It turns out Todd County, SD is the worst county to live in the country:
Table Of Contents: Top Ten | Methodology | Summary | Table
The purpose of this study is to use science to determine which of our great American counties are the absolute worst. While unbiased, this research does take into account factors that almost all Americans would agree are undesirable.
Unfortunately for the South, things aren’t very charming.
Check out more about America here:
The 10 Worst Counties To Live In The United States For 2024
Population: 9,353
Biggest City: Rosebud
Median Income: $33,792
Median Home Value: $54,094
Unemployment Rate: 15.1%

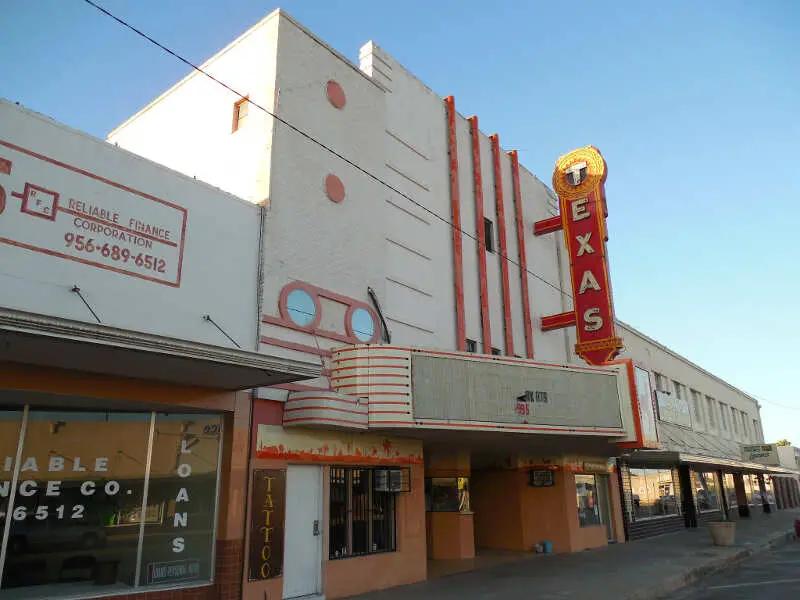
Population: 65,716
Biggest City: Rio Grande City
Median Income: $35,979
Median Home Value: $108,847
Unemployment Rate: 11.5%

I live in the Rio Grande City and i have a lot of good memories there. Im pretty sure you’d know if you’d come to texas.
Population: 3,329
Biggest City: Fort Hancock
Median Income: $35,163
Median Home Value: $71,972
Unemployment Rate: 8.2%
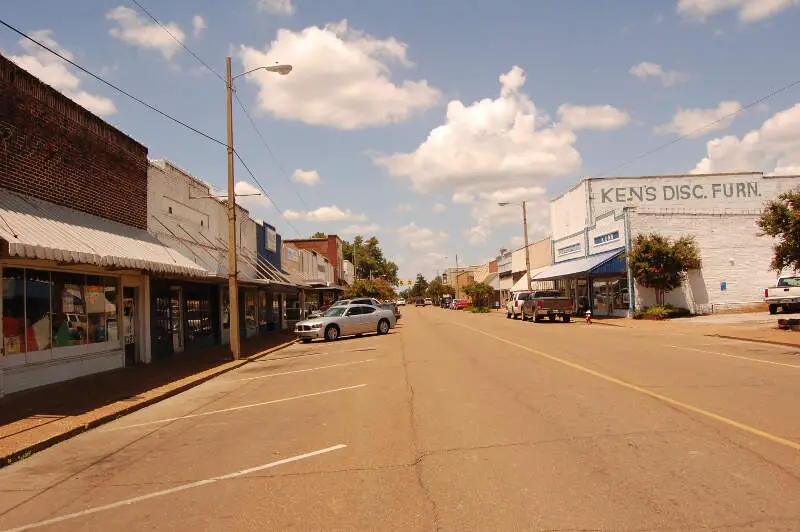
Population: 6,113
Biggest City: Marks
Median Income: $31,192
Median Home Value: $75,880
Unemployment Rate: 12.2%
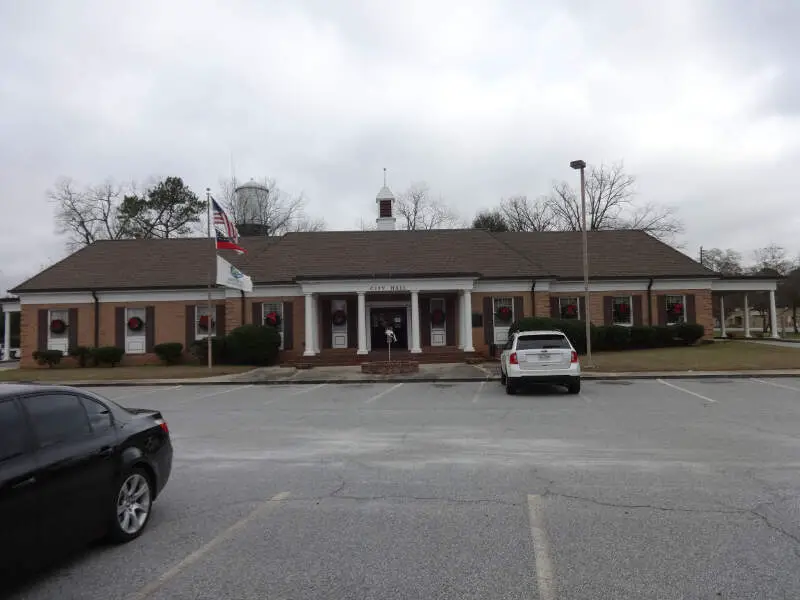
Population: 12,099
Biggest City: Montezuma
Median Income: $33,960
Median Home Value: $92,219
Unemployment Rate: 9.2%
Population: 7,744
Biggest City: Belzoni
Median Income: $31,907
Median Home Value: $81,969
Unemployment Rate: 13.7%
Population: 1,989
Biggest City: White River
Median Income: $41,397
Median Home Value: $81,075
Unemployment Rate: 16.5%
Population: 13,896
Biggest City: Zapata
Median Income: $35,061
Median Home Value: $116,418
Unemployment Rate: 8.1%
Population: 20,308
Biggest City: Raymondville
Median Income: $42,839
Median Home Value: $95,542
Unemployment Rate: 8.7%
Population: 3,910
Biggest City: Rolling Fork
Median Income: $41,000
Median Home Value: $89,344
Unemployment Rate: 12.8%
How We Determined The Worst Counties In The US
To rank the worst counties in America, we had to determine what criteria is normally associated with a bad place to live. Things like low prices indicate that demand is low and high unemployment rates mean finding a job is hard.
So, we used Saturday Night Science to research Census data. The following is the criteria we used:
- High Poverty Rates
- Highest Unemployment Rates
- Low Median Income
- Low Housing Costs
- High Drop Out Rates Among Adults
- Low Insurance Rates
We limited the analysis to counties with at least 100,000 people and then ranked each of remaining counties on each of the criteria. We then averaged those rankings together to create a “Quality Of Life Index.” The counties with the worst Quality Of Life Index ranked as the worst counties in the United States for 2024.
We updated this report for 2024. This report is our tenth time ranking the worst counties in America. This article is an opinion based on facts and is meant as infotainment — don’t freak out.
There You Have It — The Worst Counties In The US
About half of Americans consider moving, challenging the assumption of a solid attachment to their current homes. Using Saturday Night Science, we identified the ten worst U.S. counties, including Todd County, SD.
The worst counties in the US are Todd County, SD, Starr County, TX, Hudspeth County, TX, Quitman County, MS, Macon County, GA, Humphreys County, MS, Mellette County, SD, Zapata County, TX, Willacy County, TX, and Sharkey County, MS.
We based the analysis on undesirable factors like high poverty, unemployment, low median income, housing costs, adult dropout rates, and low insurance rates. The study focused on counties with over 100,000 people and utilized census data to create a precise Quality of Life Index.
Here’s a look at the best counties in America according to the data:
- Los Alamos County
- Williamson County
- Poquoson City
The Worst Counties To Live In The United States
| Rank | County | Biggest City | Population | Unemployment Rate | Home Value | Median Income |
|---|---|---|---|---|---|---|
| 1 | Todd County, SD | Rosebud | 9,353 | 15.1% | $54,094 | $33,792 |
| 2 | Starr County, TX | Rio Grande City | 65,716 | 11.5% | $108,847 | $35,979 |
| 3 | Hudspeth County, TX | Fort Hancock | 3,329 | 8.2% | $71,972 | $35,163 |
| 4 | Quitman County, MS | Marks | 6,113 | 12.2% | $75,880 | $31,192 |
| 5 | Macon County, GA | Montezuma | 12,099 | 9.2% | $92,219 | $33,960 |
| 6 | Humphreys County, MS | Belzoni | 7,744 | 13.7% | $81,969 | $31,907 |
| 7 | Mellette County, SD | White River | 1,989 | 16.5% | $81,075 | $41,397 |
| 8 | Zapata County, TX | Zapata | 13,896 | 8.1% | $116,418 | $35,061 |
| 9 | Willacy County, TX | Raymondville | 20,308 | 8.7% | $95,542 | $42,839 |
| 10 | Sharkey County, MS | Rolling Fork | 3,910 | 12.8% | $89,344 | $41,000 |
| 11 | Dawson County, TX | Lamesa | 12,342 | 9.5% | $86,931 | $45,268 |
| 12 | Cochran County, TX | Morton | 2,529 | 7.1% | $61,761 | $41,597 |
| 13 | Tallahatchie County, MS | Charleston | 12,621 | 11.0% | $93,174 | $35,428 |
| 14 | Claiborne County, MS | Port Gibson | 9,044 | 9.0% | $90,328 | $34,282 |
| 15 | Treutlen County, GA | Soperton | 6,411 | 10.9% | $108,622 | $38,641 |
| 16 | Coahoma County, MS | Clarksdale | 21,264 | 10.8% | $50,013 | $36,075 |
| 17 | Lake County, TN | Tiptonville | 6,898 | 7.0% | $87,204 | $32,064 |
| 18 | Washington County, MS | Greenville | 44,604 | 9.5% | $70,423 | $38,394 |
| 19 | Leflore County, MS | Greenwood | 27,920 | 11.8% | $78,155 | $33,115 |
| 20 | Yazoo County, MS | Yazoo City | 27,467 | 10.4% | $94,700 | $41,867 |
| 21 | Allendale County, SC | Allendale | 8,073 | 13.5% | $63,614 | $37,096 |
| 22 | Sioux County, ND | Cannon Ball | 3,896 | 20.7% | $104,945 | $41,201 |
| 23 | Calhoun County, GA | Morgan | 5,594 | 11.4% | $81,863 | $48,663 |
| 24 | Bamberg County, SC | Denmark | 13,311 | 11.0% | $83,460 | $43,920 |
| 25 | Webster County, GA | Webster County Unified Government | 2,354 | 8.9% | $124,181 | $35,000 |
| 26 | Dillon County, SC | Dillon | 28,255 | 7.2% | $89,042 | $42,454 |
| 27 | Marlboro County, SC | Bennettsville | 26,585 | 7.8% | $82,122 | $34,275 |
| 28 | Buffalo County, SD | Fort Thompson | 1,859 | 14.9% | $138,643 | $42,917 |
| 29 | Noxubee County, MS | Macon | 10,261 | 9.3% | $93,664 | $42,298 |
| 30 | Holmes County, MS | Tchula | 16,848 | 8.8% | $63,005 | $28,818 |
| 31 | Presidio County, TX | Presidio | 6,168 | 12.3% | $185,506 | $29,012 |
| 32 | Sunflower County, MS | Indianola | 25,867 | 11.1% | $98,983 | $37,403 |
| 33 | Terrell County, GA | Dawson | 9,004 | 8.7% | $98,144 | $43,507 |
| 34 | Duval County, TX | San Diego | 9,960 | 8.4% | $71,394 | $50,697 |
| 35 | Wheeler County, GA | Alamo | 7,550 | 6.4% | $123,492 | $36,354 |
| 36 | Menard County, TX | Menard | 1,964 | 14.3% | $149,618 | $40,945 |
| 37 | Issaquena County, MS | Mayersville | 1,206 | 12.1% | $111,562 | $17,900 |
| 38 | Casey County, KY | Liberty | 15,942 | 10.4% | $116,664 | $42,190 |
| 39 | Culberson County, TX | Van Horn | 2,181 | 10.1% | $114,922 | $35,924 |
| 40 | Pemiscot County, MO | Caruthersville | 15,555 | 9.6% | $93,182 | $37,426 |
| 41 | Jackson County, SD | Wanblee | 2,838 | 7.4% | $109,912 | $26,078 |
| 42 | Tunica County, MS | Tunica Resorts | 9,787 | 12.2% | $108,830 | $41,676 |
| 43 | Hall County, TX | Memphis | 2,847 | 7.5% | $68,435 | $43,873 |
| 44 | Kemper County, MS | De Kalb | 8,980 | 14.1% | $123,374 | $42,947 |
| 45 | Mitchell County, GA | Camilla | 21,634 | 9.5% | $129,514 | $45,966 |
| 46 | Bolivar County, MS | Cleveland | 30,688 | 7.4% | $128,378 | $37,845 |
| 47 | Newton County, TX | Newton | 12,333 | 10.6% | $151,121 | $38,871 |
| 48 | Swisher County, TX | Tulia | 6,989 | 5.2% | $87,510 | $40,290 |
| 49 | Chicot County, AR | Dermott | 10,234 | 10.9% | $79,970 | $36,593 |
| 50 | Wayne County, MS | Waynesboro | 19,760 | 8.7% | $135,700 | $34,875 |
| 51 | Randolph County, GA | Cuthbert | 6,365 | 7.5% | $90,535 | $24,638 |
| 52 | Emanuel County, GA | Swainsboro | 22,907 | 8.9% | $110,600 | $47,905 |
| 53 | Seminole County, OK | Seminole | 23,592 | 7.2% | $100,697 | $43,239 |
| 54 | Corson County, SD | Mclaughlin | 3,906 | 24.6% | $119,173 | $48,125 |
| 55 | Madison Parish, LA | Tallulah | 10,028 | 5.8% | $68,554 | $34,508 |
| 56 | Evangeline Parish, LA | Ville Platte | 32,335 | 14.0% | $112,452 | $34,526 |
| 57 | Lawrence County, MS | Monticello | 11,933 | 12.0% | $118,070 | $41,096 |
| 58 | Pushmataha County, OK | Antlers | 10,845 | 9.0% | $126,595 | $42,274 |
| 59 | Wayne County, MO | Piedmont | 11,081 | 8.3% | $113,898 | $42,758 |
| 60 | Lee County, VA | Pennington Gap | 22,287 | 8.1% | $90,760 | $41,619 |
| 61 | Marion County, MS | Columbia | 24,362 | 9.5% | $125,790 | $38,399 |
| 62 | Quitman County, GA | Georgetown-Quitman County Unified Government | 2,180 | 23.5% | $121,909 | $38,889 |
| 63 | Pike County, MS | Mccomb | 40,098 | 7.2% | $100,926 | $40,131 |
| 64 | Turner County, GA | Ashburn | 8,894 | 7.0% | $115,002 | $39,666 |
| 65 | San Augustine County, TX | San Augustine | 7,920 | 10.3% | $152,950 | $45,888 |
| 66 | Marion County, SC | Marion | 29,212 | 6.8% | $80,421 | $35,972 |
| 67 | Baker County, GA | Newton | 2,878 | 12.2% | $104,019 | $45,417 |
| 68 | Robeson County, NC | Lumberton | 117,573 | 6.4% | $127,047 | $39,393 |
| 69 | Union County, SC | Union | 27,158 | 10.2% | $103,550 | $42,305 |
| 70 | Crisp County, GA | Cordele | 20,255 | 8.2% | $124,684 | $47,463 |
| 71 | Dimmit County, TX | Carrizo Springs | 8,672 | 4.7% | $104,605 | $27,374 |
| 72 | Halifax County, NC | Roanoke Rapids | 48,772 | 9.3% | $84,518 | $41,629 |
| 73 | Montgomery County, MS | Winona | 9,803 | 7.8% | $99,995 | $36,845 |
| 74 | Dougherty County, GA | Albany | 85,038 | 10.0% | $115,904 | $45,640 |
| 75 | Dunklin County, MO | Kennett | 28,174 | 5.7% | $79,724 | $44,868 |
| 76 | Colquitt County, GA | Moultrie | 45,813 | 6.1% | $124,310 | $47,235 |
| 77 | Atkinson County, GA | Pearson | 8,265 | 4.6% | $100,744 | $38,007 |
| 78 | Scotland County, NC | Laurinburg | 34,222 | 10.8% | $129,675 | $41,948 |
| 79 | Macon County, AL | Tuskegee | 19,198 | 12.5% | $89,781 | $41,206 |
| 80 | Adams County, MS | Natchez | 29,425 | 7.1% | $117,979 | $37,271 |
| 81 | Mcdowell County, WV | Welch | 18,911 | 15.1% | $29,596 | $28,235 |
| 82 | Desoto County, FL | Southeast Arcadia | 34,258 | 9.7% | $187,577 | $45,000 |
| 83 | Tensas Parish, LA | Newellton | 4,127 | 12.4% | $111,286 | $35,653 |
| 84 | Jim Hogg County, TX | Hebbronville | 4,830 | 4.5% | $77,756 | $42,292 |
| 85 | Jefferson Davis County, MS | Prentiss | 11,291 | 9.2% | $91,069 | $36,473 |
| 86 | Stewart County, GA | Richland | 5,121 | 5.1% | $59,072 | $43,094 |
| 87 | Monroe County, AR | Brinkley | 6,787 | 11.0% | $72,006 | $41,786 |
| 88 | Dewey County, SD | North Eagle Butte | 5,275 | 14.6% | $99,908 | $55,077 |
| 89 | Mingo County, WV | Williamson | 23,466 | 11.2% | $61,108 | $38,305 |
| 90 | Bertie County, NC | Windsor | 17,818 | 6.4% | $55,749 | $41,652 |
| 91 | St. Helena Parish, LA | Greensburg | 10,872 | 21.5% | $105,234 | $46,402 |
| 92 | Hidalgo County, TX | Mcallen | 873,167 | 7.6% | $180,070 | $49,371 |
| 93 | Taylor County, GA | Butler | 7,799 | 6.6% | $131,504 | $40,727 |
| 94 | Hancock County, TN | Sneedville | 6,726 | 10.1% | $164,774 | $31,809 |
| 95 | Johnson County, GA | Wrightsville | 9,225 | 8.3% | $114,072 | $47,796 |
| 96 | Irwin County, GA | Fitzgerald | 9,487 | 6.2% | $118,845 | $46,383 |
| 97 | Wilcox County, AL | Camden | 10,441 | 10.7% | $133,582 | $38,208 |
| 98 | Lee County, SC | Bishopville | 16,557 | 9.2% | $135,762 | $39,099 |
| 99 | Hughes County, OK | Holdenville | 13,409 | 6.3% | $92,011 | $44,799 |
| 100 | Yukon-Koyukuk Census Area, AK | Galena | 5,355 | 11.1% | $95,193 | $47,826 |
Worst Counties Places By State
Most Dangerous Cities In Alaska
Most Dangerous Cities In Alabama
Most Dangerous Places In Arkansas
Most Dangerous Cities In Arizona
Most Dangerous Cities In California
Most Dangerous Cities In Colorado
Most Dangerous Cities In Connecticut
Most Dangerous Cities In Delaware
Most Dangerous Places In Florida
Most Dangerous Places In Georgia
Most Dangerous Cities In Idaho
Most Dangerous Cities In Illinois
Most Dangerous Cities In Indiana
Most Dangerous Places In Kansas
Most Dangerous Cities In Massachusetts
Most Dangerous Cities In Maryland
Most Dangerous Cities In Maine
Most Dangerous Places In Michigan
Most Dangerous Cities In Minnesota
Most Dangerous Cities In Missouri
Most Dangerous Cities In Mississippi
Most Dangerous Cities In Montana
Most Dangerous Cities In North Carolina
Most Dangerous Cities In North Dakota
Most Dangerous Cities In Nebraska
Most Dangerous Cities In New Hampshire
Most Dangerous Cities In New Jersey
Most Dangerous Cities In New Mexico
5 Most Dangerous Cities In Nevada
Most Dangerous Cities In Oklahoma
Most Dangerous Cities In Oregon
Most Dangerous Cities In Pennsylvania
Most Dangerous Cities In Rhode Island
Most Dangerous Cities In South Carolina
Most Dangerous Cities In South Dakota
Most Dangerous Cities In Tennessee
Most Dangerous Places In Texas
Most Dangerous Cities In Virginia
Most Dangerous Cities In Vermont
Most Dangerous Cities In Washington
Most Dangerous Cities In Wisconsin
Oh good, Tillman County is worse off than Jackson County, Oklahoma….whew! Nick James, you sure did produce a polished gem of journalism. Obviously you have a beef with my home state. Where are you from anyway? You must be one of the lucky ones.
What are you talking about ? I don’t see Oklahoma mention in article or on the list ??
You might want to rethink the criteria for evaluating worst counties. Anne Arundel County in Maryland is absolutely lousy, especially relative to the outrageous cost-of-living, taxes which are ever increasing and are wasted on idiocies, senseless over-development, and an absolute lack of any law enforcement relative to traffic laws, i.e. speeding, tail-gating, and the new hideous phenomenon of souped-up cars which make a din day and night. Repeated e-mails and phone calls to state senators and delegates as well as county officials are of absolutely no avail. If you want to pay a lot of taxes and have a very LOW quality of life, then come to Maryland in general and Anne Arundel County in particular. It is “Dukes of Hazard” country with near New York prices, but none of the cute girls in Daisy Duke shorts. Be sure to bring your noise-making grocery-runner vehicle so that you can fit in with the many knuckle draggers here. You, too, can experience the nightmare! Halloween very day! You’ll only get a run-around from the so-called government here, it is hapless and hopeless. Both political parties suck!